洛马普里塔地震分析
1、从加载数据开始。
load quake
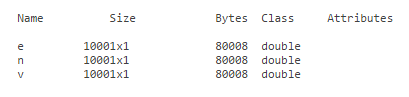
whos e n v
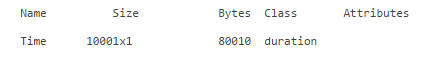
2、Time = (1/200)*seconds(1:length(e))';
whos Time
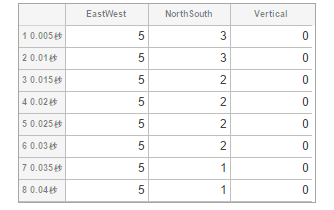
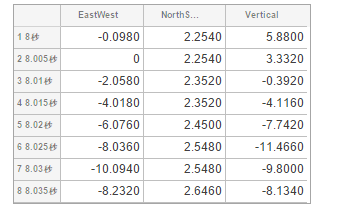
3、varNames = {'EastWest', 'NorthSouth', 'Vertical'};
quakeData = timetable(Time, e, n, v, 'VariableNames', varNames);
head(quakeData)
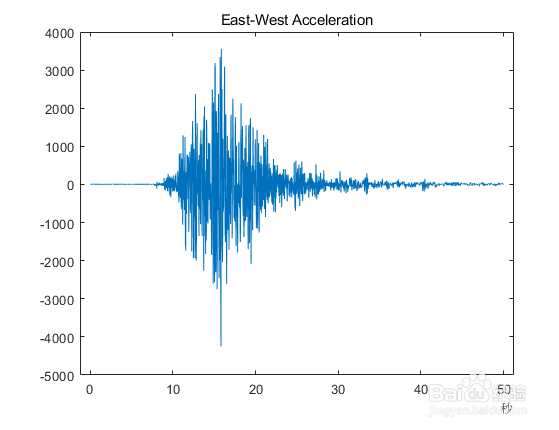
4、plot(quakeData.Time,quakeData.EastWest)
title('East-West Acceleration')
5、quakeData.Variables = 0.098*quakeData.Variables;
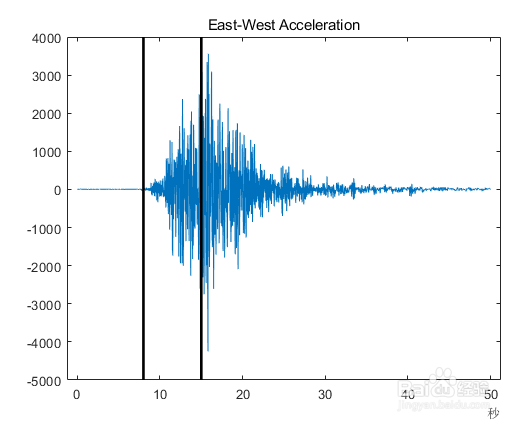
6、t1 = seconds(8)*[1;1];
t2 = seconds(15)*[1;1];
hold on
plot([t1 t2],ylim,'k','LineWidth',2)
hold off
7、tr = timerange(seconds(8),seconds(15));
dataOfInterest = quakeData(tr,:);
head(dataOfInterest)
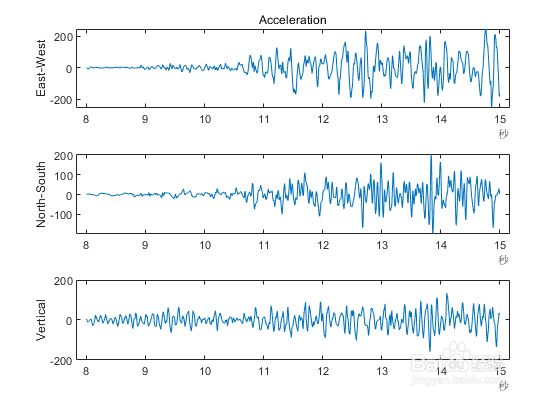
8、figure
subplot(3,1,1)
plot(dataOfInterest.Time,dataOfInterest.EastWest)
ylabel('East-West')
title('Acceleration')
subplot(3,1,2)
plot(dataOfInterest.Time,dataOfInterest.NorthSouth)
ylabel('North-South')
subplot(3,1,3)
plot(dataOfInterest.Time,dataOfInterest.Vertical)
ylabel('Vertical')