用Mathematica处理几何问题——点、线段
1、 绘制一个点:
Graphics[Point[{2, 3}]]
注意点的坐标用{}括起来。

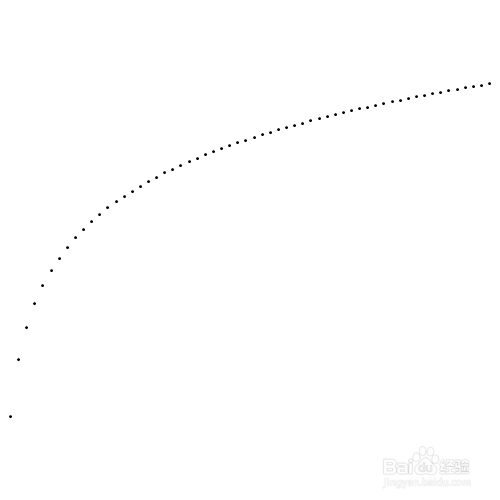
2、 绘制多个点:
Graphics[Point[Table[{t, Log[t]}, {t, 0.1, 6, 1/10}]]]
3、 改变点的样式,粉红色的大点:
Graphics[{PointSize[Large], Pink,
Point[Table[{Cos[t], Sin[t]}, {t, 0, 2 \[Pi], \[Pi]/10}]]}]

4、 绘制365个随机的点,颜色、大小、位置都是随机的:
Graphics[Table[{Hue[RandomReal[]], PointSize[RandomReal[{0, 0.1}]], Point[RandomReal[1, {2}]]}, {365}]]
这段代码每次运行,都可能会有不同的结果。


5、 简单地把点分类,用Point画出来:
【{red, green} =
Last@Reap@
Scan[If[#[[1]]^2 + #[[2]]^2 < 2 && #[[1]] + #[[2]] < 1,
Sow[#, "Red"], Sow[#, "Green"]] &,
RandomReal[{-2, 2}, {8888, 2}]];
Graphics[{{Red, Point[red]}, {Green, Point[green]}}]】

1、 线段,用Line实现。线段的端点的坐标,全放在{英文输入法的括号}里面:
Graphics[Line[{{0, 0}, {3, 4}}]】

2、 画多条线段,围成一个三角形(折线段的端点,这些点的坐标,全放在{英文输入法的括号}里面)。
Graphics[Line[{{0, 0}, {3, 4}, {0, 4}, {0, 0}}]】

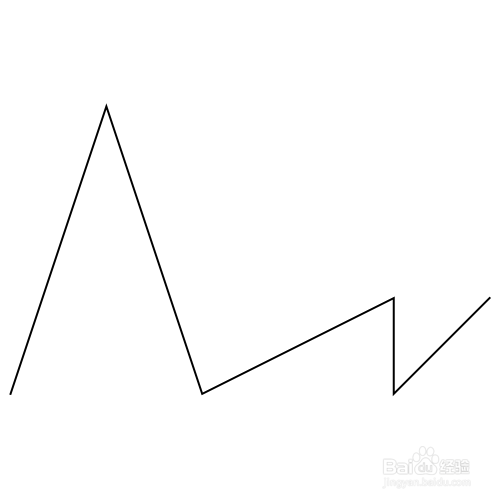
3、 绘制不同样式的线段(注意{}的用法):
l = Line[{{1, 0}, {2, 3}, {3, 0}, {5, 1}, {5, 0}, {6, 1}}];
Graphics[{Thick, l}, ImageSize -> {500, 500}]】
Graphics[{Thick, Dashed, Blue, l}】

4、 绘制曲线的切向量(这里涉及微分几何的知识):
With[{f = {Cos[x] + Sin[2 x], 2 Cos[x] + Sin[3 x]}},
Graphics[Table[{Hue[t/(2 Pi), 1, .8],
Line[{f, Normalize[D[f, x]] + f}]} /. x -> t, {t, 0, 2 Pi, .05}]】
和
With[{f = {Cos[3 x] + Sin[2 x], 2 Cos[x] + Sin[3 x]}},
Graphics[Table[{Hue[t/(2 Pi), 1, .8],
Line[{f, Normalize[D[f, x]] + f}]} /. x -> t, {t, 0, 2 Pi, .05}]】


5、 绘制有八个点的完全图(这是图论的知识):
p = Tuples[Table[{Cos[t] + Sin[2 t], Sin[t]}, {t, 0, 2 Pi, 2 Pi/8}], 2];
Graphics[Line[p]】

6、 绘制曲线的切线簇(涉及射影几何、代数几何等理论):
f[x_] := x^2 + x
p = Table[{{a - 2, f'[a] ((a - 2) - a) + f[a]}, {a + 2,
f'[a] ((a + 2) - a) + f[a]}}, {a, -10, 10, .1}];
Graphics[Line[p], PlotRange -> {{-1, 1}, {-1, 1}}】
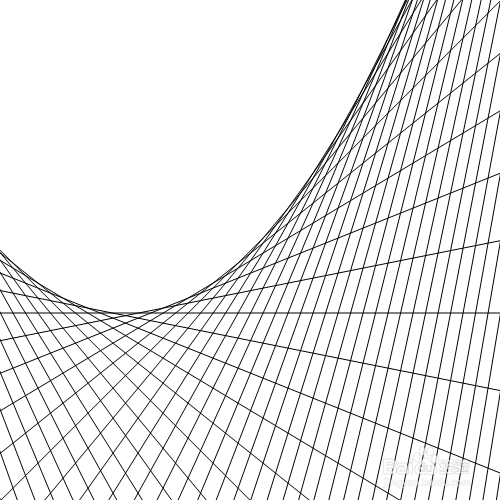
7、 绘制摩尔的视觉误差条纹:
Graphics[Table[
Line[{{{x, 0}, {1 - x, 1}}, {{0, x}, {1, 1 - x}}}], {x, 0, 1, .02}]】
