使用Stata做集中指数&集中曲线
1、首先使用excel将原始数据编辑完整。
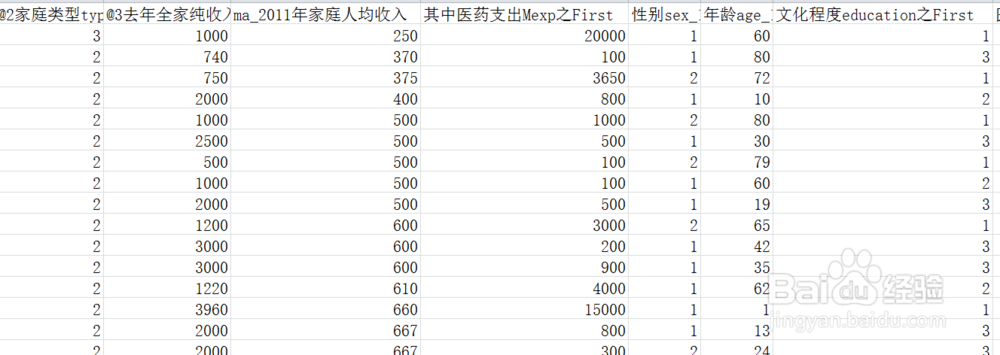
在Excel中至少有两列数据,一列是作为标准的参照列,例如居民年收入水平,并且按照参照列按从小到大排序;另外的一列是要考察公平性的列,例如居民的医疗服务利用,可以是门诊支出,或者是住院支出,或者是门诊次数,或者是住院次数。要看研究的目的。
如果研究者还要进一步的分解在不同组别的公平性,例如性别之间公平性的差异,年龄段之间公平性的差异等等,可以再添加相应的列,一定要是整数。
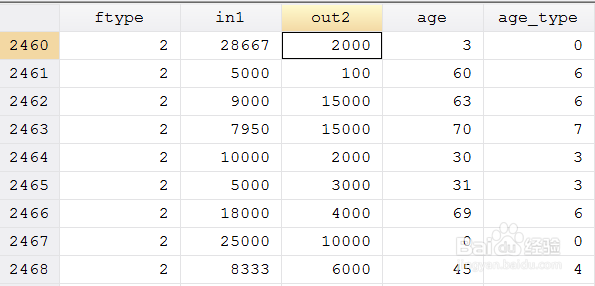
2、将编辑好的excel数据,复制到Stata中。
可以在Stata中使用edit命令,编辑新的数据库。如果在这之前有数据库打开,最好使用Clear命令清空内存,建立一个新的数据库。
建好数据库后,一定要检查一下数据库各列的数据类型。用来分组的列一定要是int类型。
做好后,保存。返回Stata命令界面。
3、试探运行一下集中指数命令:conindex
如果提示没有这个命令,可以使用help查找,来帮助安装。
4、使用stata中的conindex命令计算集中指数和绘制集中曲线。
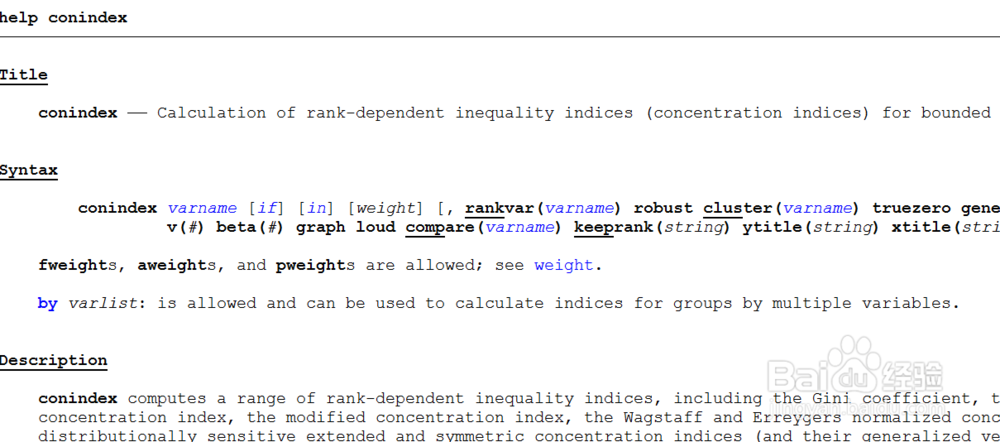
以下解释来自stata help:
conindex -- Calculation of rank-dependent inequality indices (concentration indices) for bounded and unbounded variables,计算集中指数
语法:
conindex varname [if] [in] [weight] [, rankvar(varname) robust cluster(varname) truezero generalized bounded limits(#1 #2) wagstaff erreygers
v(#) beta(#) graph loud compare(varname) keeprank(string) ytitle(string) xtitle(string) svy]
解释:
Gini coefficient :基尼系数计算公式
= 2/N^2*mu_Y * Sum[Y_i*R_i]
Stata命令: conindex Y, truezero
Generalized Gini :通用基尼系数计算公式
= 2/N^2 * Sum[Y_i*R_i]
Stata命令:conindex Y, truezero generalized
Concentration index :集中指数计算公式
= 2/N^2*mu_h * Sum[h_i*R_i]
Stata命令: conindex h, rankvar(Y) truezero
Generalized concentration index :通用的集中指数计算公式
= 2/N^2 * Sum[h_i*R_i]
Stata命令:conindex h, rankvar(Y) truezero generalized
Modified concentration index :改变的集中指数计算公式
= 2/(N^2(mu_h - min(h_i)) * Sum(h_i*R_i)
Stata命令: conindex h, rankvar(Y) limits(10)
Extended concentration index :扩展的集中指数计算公式
= 1/mu_h * Sum[(1-v(1-R_i)^(v-1))/N] * h_i v>1
Stata命令: conindex h, rankvar(Y) v(3) truezero
5、根据年龄分段进行集中指数分解:
For groups:
CI for group 1: age_type = 0
Index: | No. of obs. | Index value | Std. error | p-value |
CI | 431 | .0427213 |.04412536 | 0.3335 |
------------------------------------------------------------------------------+
期间省略1到8分组......
CI for group 10: age_type = 9
Index: | No. of obs. | Index value | Std. error | p-value |
CI | 6 | .56975585 |.29308716 | 0.1238 |
------------------------------------------------------------------------------+
Test for stat. significant differences with Ho: diff=0 (assuming equal variances)
F-stat = 2.7088678 | p-value= 0.0038 |
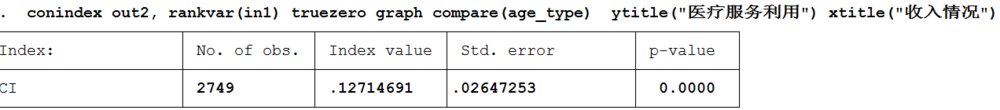
6、集中指数分析结论:
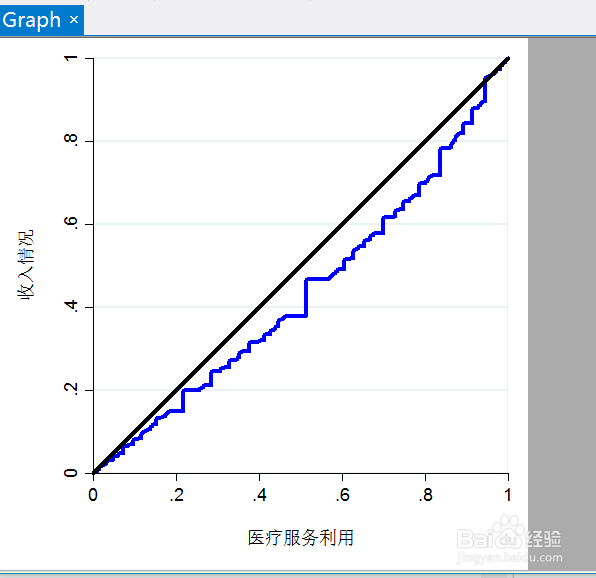
. conindex out2, rankvar(in1) truezero
Index: | No. of obs. | Index value | Std. error | p-value |
CI | 2749 | .12714691 |.02647253 | 0.0000
从上面的数据可以看出,这个集中指数是0.1271,并且显著不等于0,说明在收入为标准的情况下,卫生服务支出是不平等(公平性)的。