用Mathematica给图片添加文字(02)
1、 用Labeled给圆加标注——“单位圆”:
Labeled[Graphics[Circle[], Text[单位圆]]
注意,这里添加的文字是文本形式,不属于图片的一部分。

2、 给文字添加会变化的标签,用鼠标点击标签,就会发生变化:
DynamicModule[{c},
Labeled[Graphics[{Dynamic[c], Disk[]}, ImageSize -> Tiny],
Toggler[Dynamic[c], Reverse /@ ColorData["HTML", "ColorRules"],
ImageSize -> Automatic]]]

3、 绘制多条函数曲线,并用Inset添加标签:
legendPlot[xl_List, d_, args___] := Plot[xl, d, Epilog -> Inset[Panel[
Grid[MapIndexed[{Graphics[{ColorData[1, First@#2], Thick,
Line[{{0, 0}, {1, 0}}]}, AspectRatio -> .1,
ImageSize -> 20], #1} &, xl]]],
Offset[{-2, -2}, Scaled[{1, 1}]], {Right, Top}], args];
legendPlot[{Sin[x], Cos[x], Sinc[x]}, {x, 0, 10}]

4、 用ChartLabels给条形统计图添加标签,并用Placed指定标签的位置:
Table[BarChart[{1, 2, 3}, ChartLabels -> Placed[{"a", "b", "c"}, p],
PlotLabel -> p], {p, {Bottom, Center, Top}}]


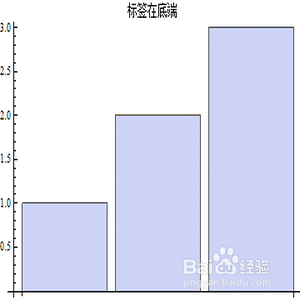
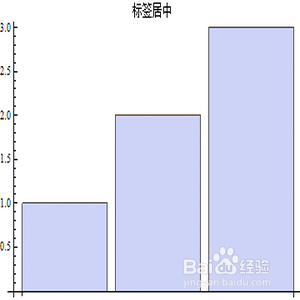
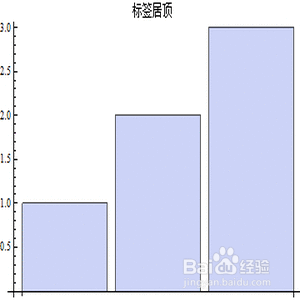
5、 不明白为什么下面这个代码无法显示标签:
Table[BarChart[{1, 2, 3}, ChartLabels -> Placed[{"a", "b", "c"}, p],
PlotLabel -> p], {p, {"标签在底端", "标签居中", "标签居顶"}}]


6、 给条形统计图内部添加标签:
Table[PieChart[{1, 2, 3}, ChartLabels -> Placed[{"a", "b", "c"}, p],
SectorOrigin -> {Automatic, 1},
PlotLabel -> p], {p, {"RadialInner", "RadialCenter",
"RadialOuter"}}]
看下面的动态图:

7、 给条形统计图外部添加标签:
Table[PieChart[{1, 2, 3}, ChartLabels -> Placed[{"a", "b", "c"}, p],
SectorOrigin -> {Automatic, 1},
PlotLabel -> p], {p, {"RadialInside", "RadialEdge",
"RadialOutside"}}]
