Matlab plot多条曲线使用legend标注某几条图例
1、首先,我们创建六条曲线,分两次绘制曲线
x = 0 : 0.01 : 4*pi;
y1 = sin(x);
y2 = cos(x);
y3 = 3*cos(x);
y4 = cos(x).*sin(x);
y5 = cos(x) + sin(x);
y6 = cos(x) - 2*sin(x);
h1 = plot(x,y1,x,y2,x,y3);
hold on
h2 = plot(x,y4,x,y5,x,y6);

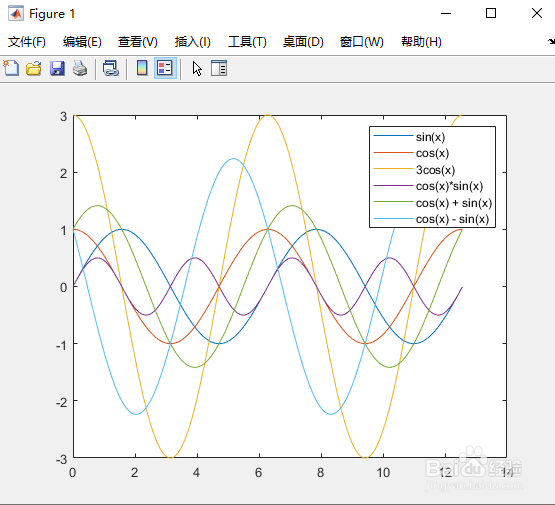
2、画出来的图像如图所示。

3、接下来我们添加图例
legend('sin(x)','cos(x)','3cos(x)','cos(x)*sin(x)','cos(x) + sin(x)','cos(x) - sin(x)')
观察每条曲线的颜色,如图
4、然后我们选择曲线1,曲线3,曲线5添加图例
legend([h1(1),h1(3),h2(2)],'sin(x)','3cos(x)','cos(x) + sin(x)')
更改曲线1,曲线3,曲线5的显示方式,如图

5、运行程序,观察结果

6、注意我们画图时要记录句柄值,例子中的h1,h2
声明:本网站引用、摘录或转载内容仅供网站访问者交流或参考,不代表本站立场,如存在版权或非法内容,请联系站长删除,联系邮箱:site.kefu@qq.com。
阅读量:49
阅读量:106
阅读量:84
阅读量:136
阅读量:68