【Mathematica】鲸鱼叫声可视化
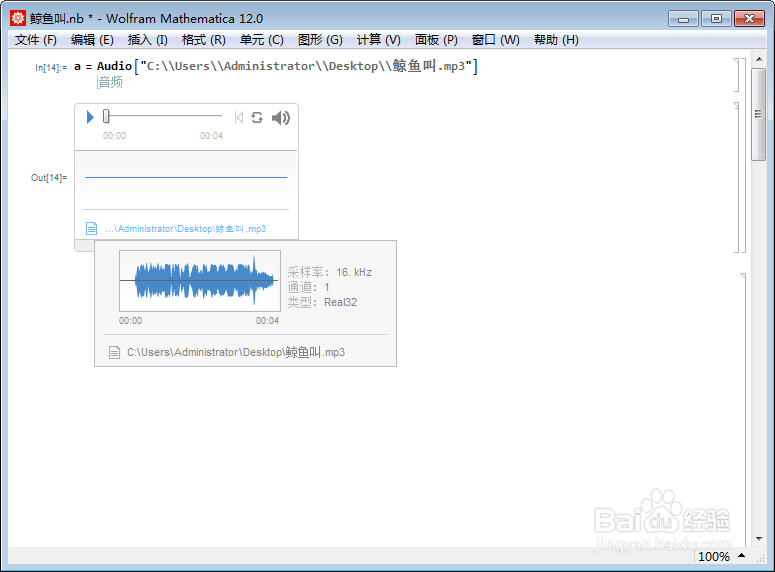
1、读取音频:
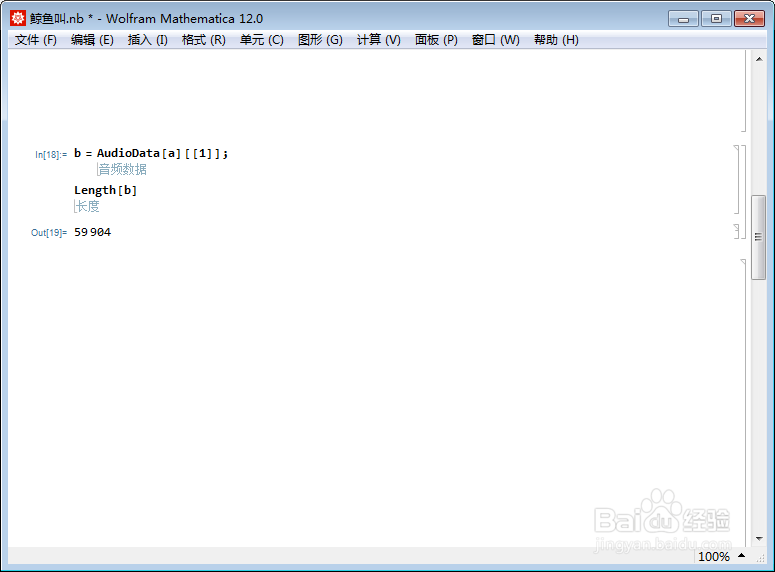
2、把音频转化为数据,并提取其中一个通道:
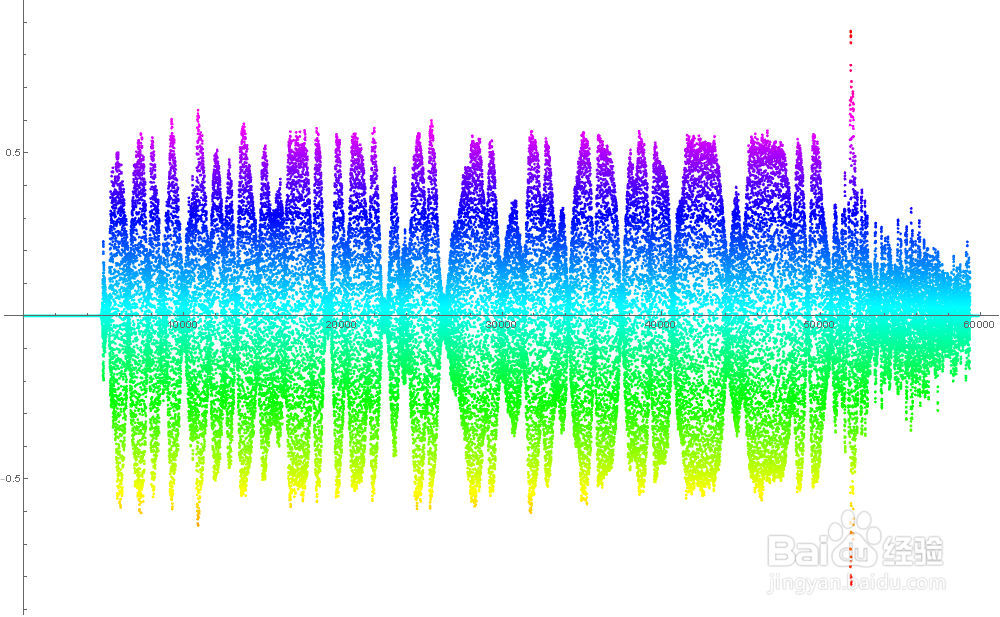
3、绘制散点图:

4、成图如下。
Mathematica自动把音频波峰视为1,其余按比例缩小。
5、把散点图转化为极坐标图:
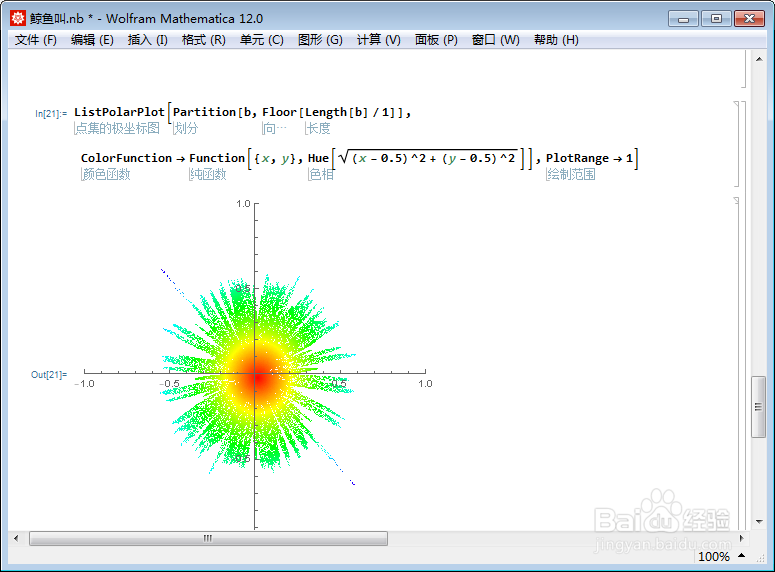
6、图片如下。所有数据绕了一圈。
7、所有数据均匀的绕两圈:
Partition[b, Floor[Length[b]/2]]
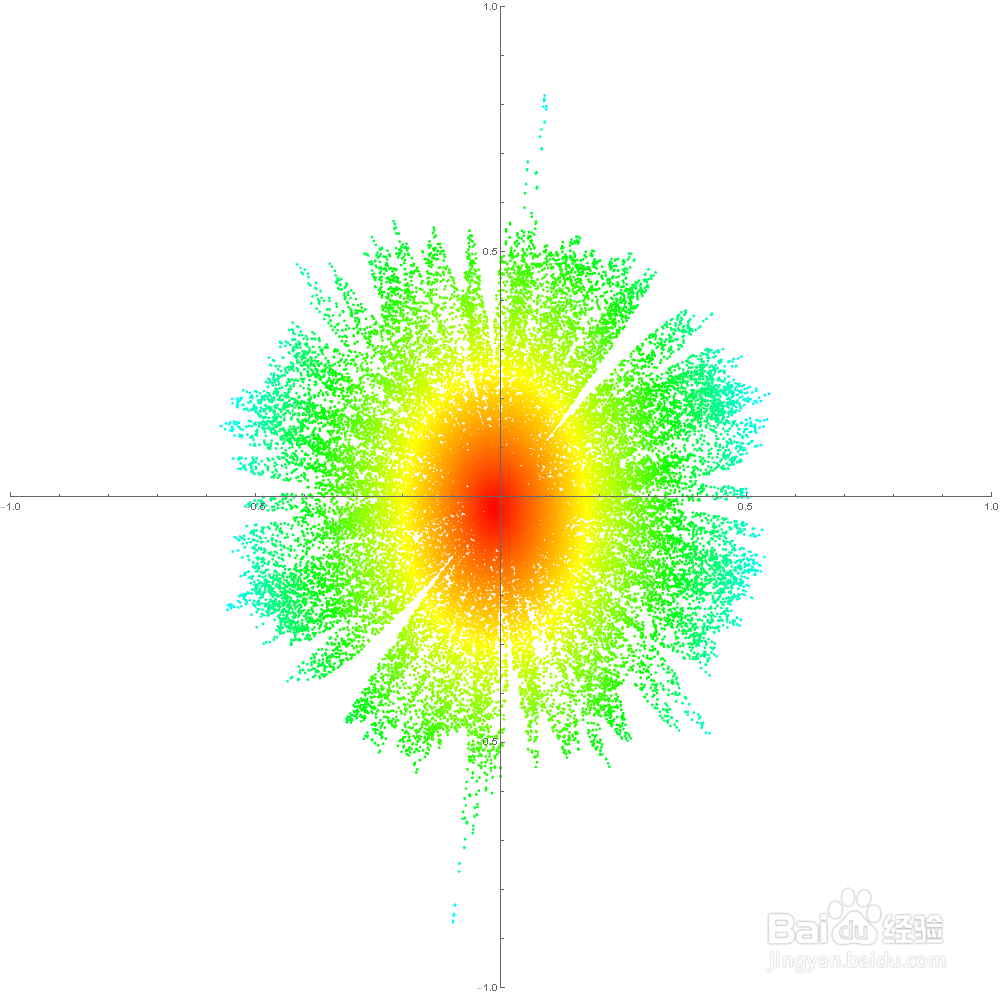
8、所有数据均匀的绕10圈:
Partition[b, Floor[Length[b]/10]]
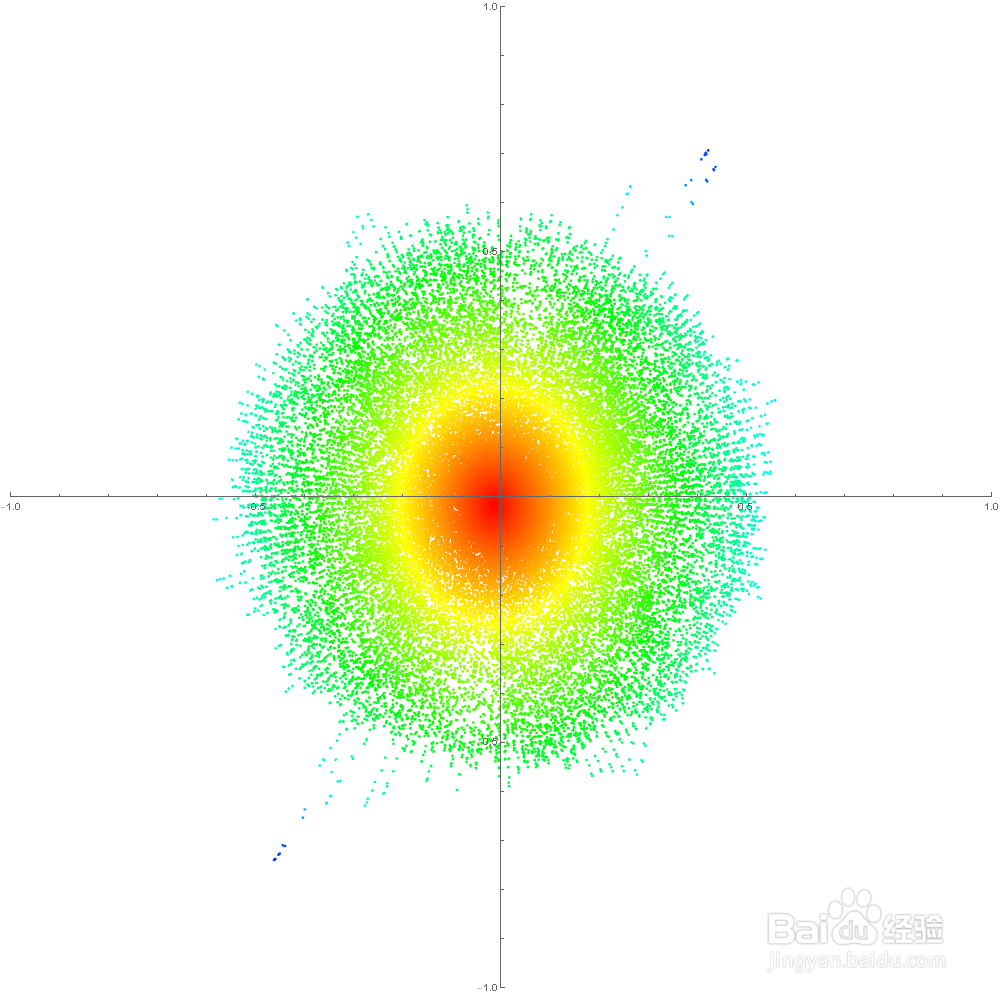
9、所有数据均匀的绕100圈:
Partition[b, Floor[Length[b]/100]]
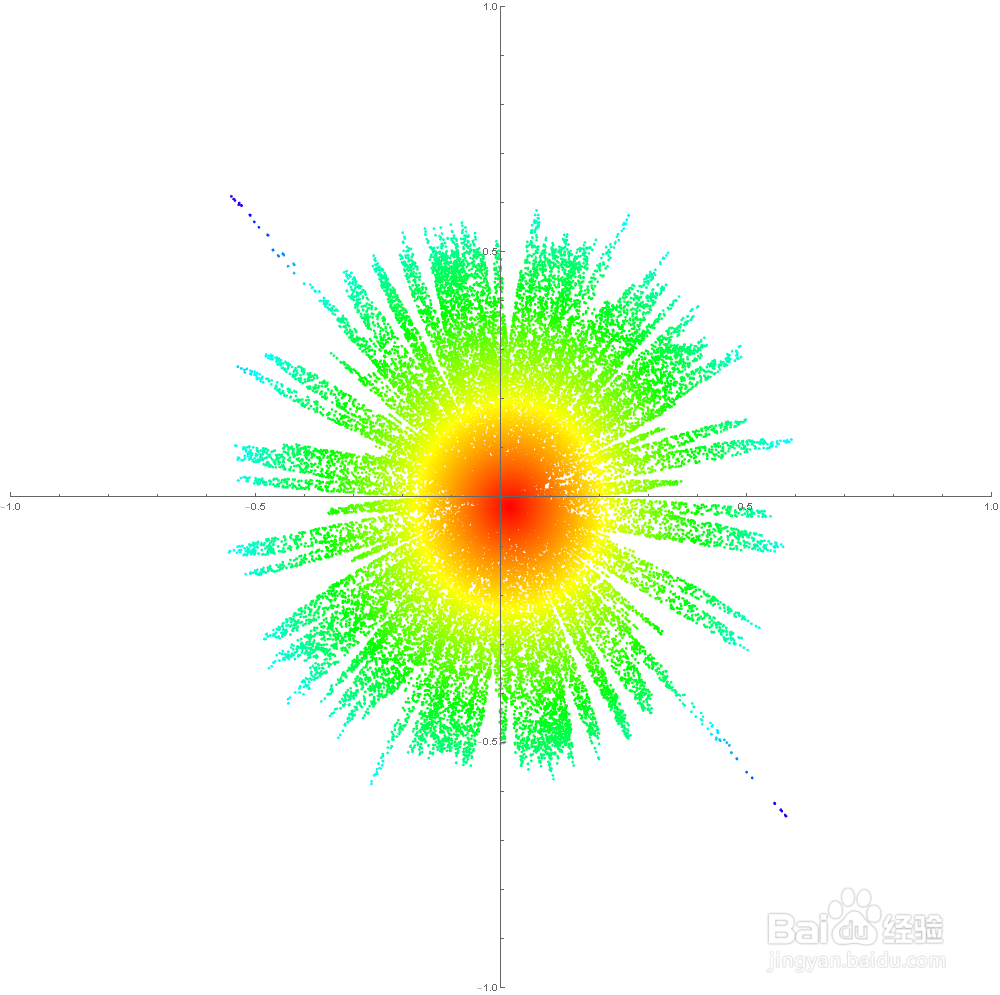
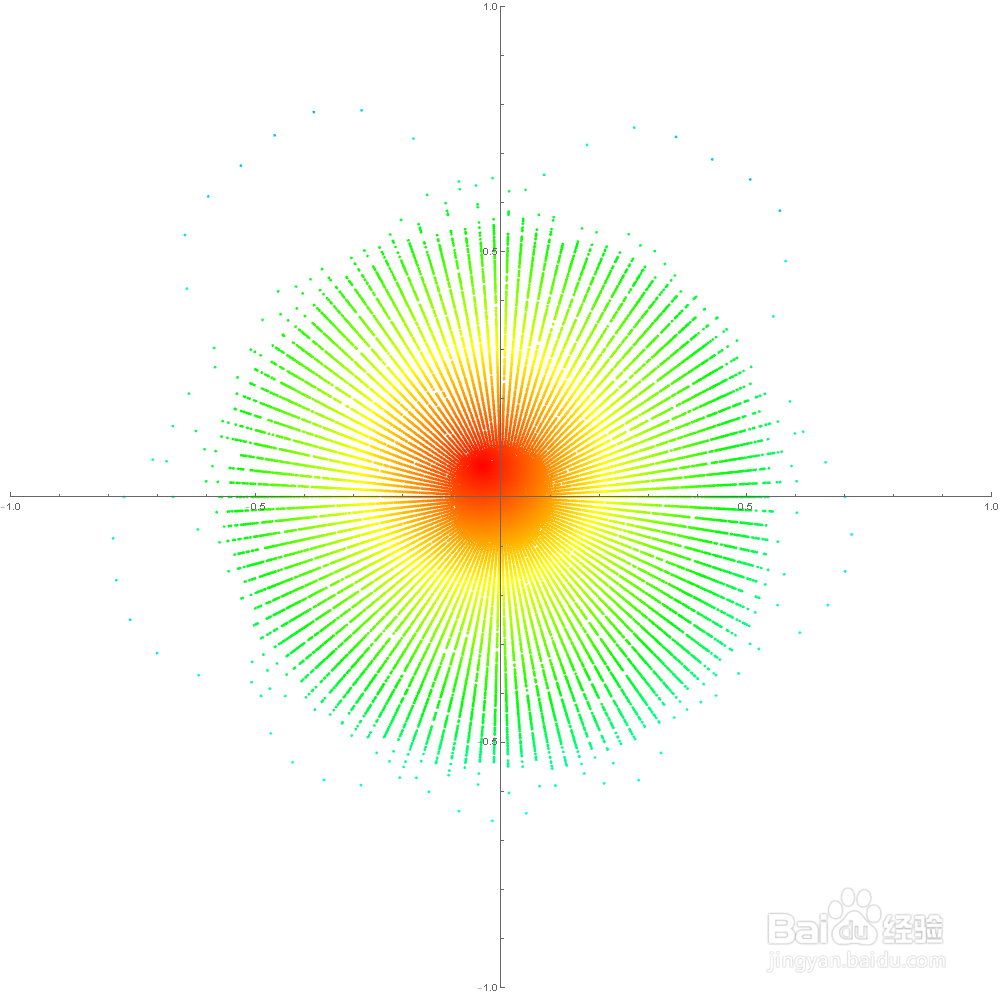
10、1000圈的效果,出现了层次分明的辐条形状:
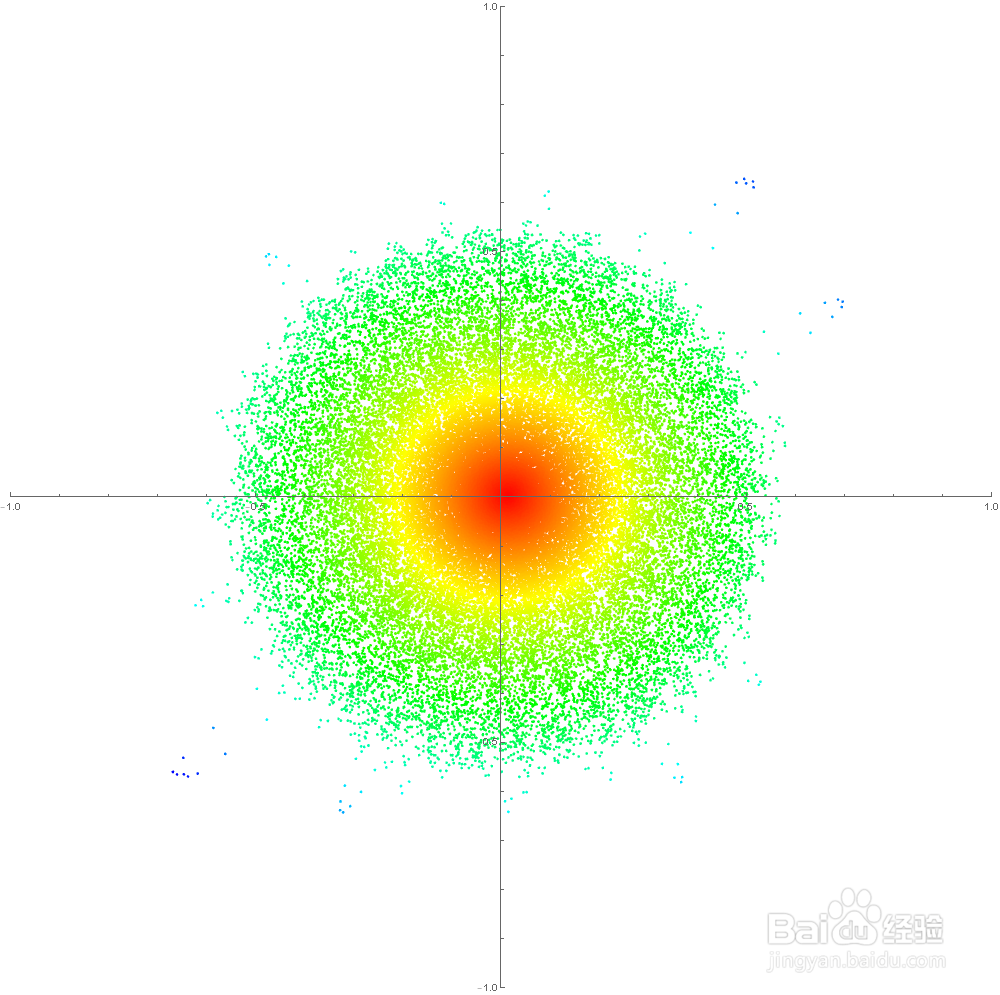
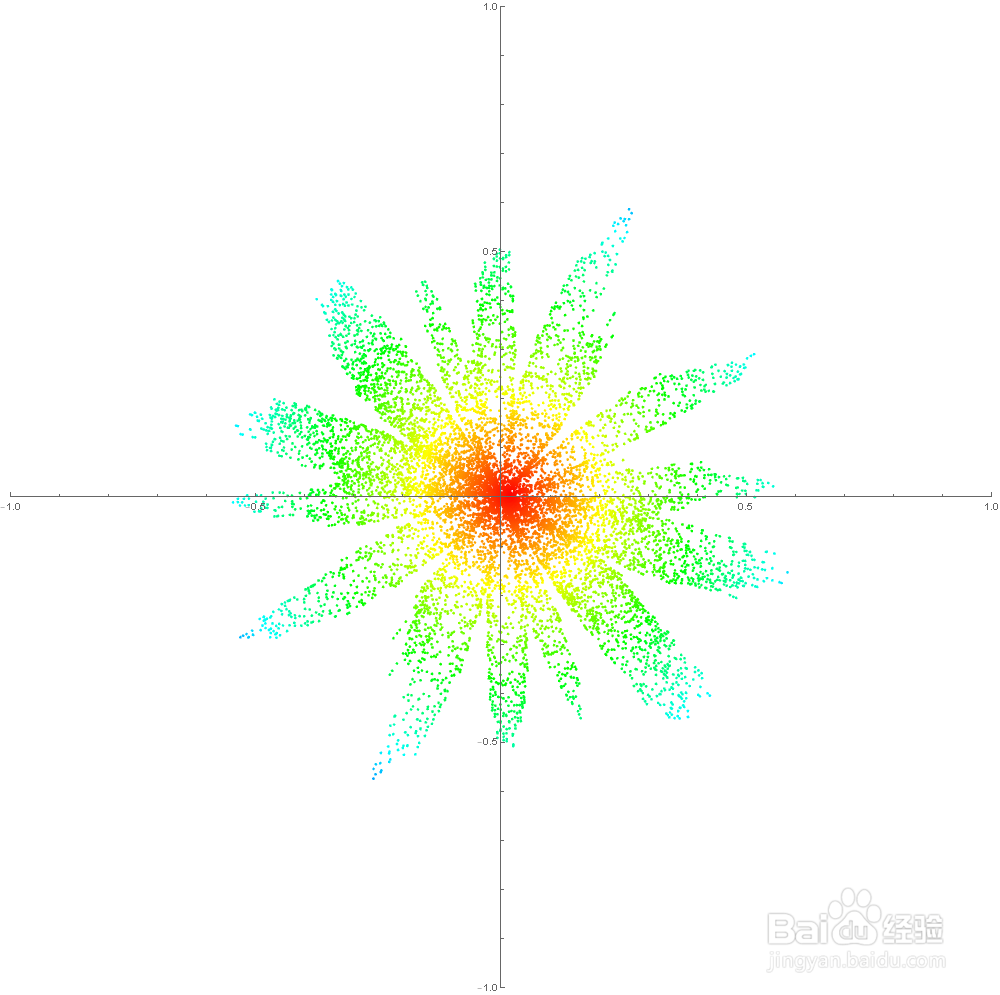
11、1秒钟的效果图:
b[[;; 16000]]
这一秒,有16000个采样数据(采样率是16000)。
声明:本网站引用、摘录或转载内容仅供网站访问者交流或参考,不代表本站立场,如存在版权或非法内容,请联系站长删除,联系邮箱:site.kefu@qq.com。
阅读量:188
阅读量:117
阅读量:156
阅读量:52
阅读量:192