Mathematica基础——各种标签的用法
本文,介绍一下Mathematica里面,对各种标签的操作。

工具/原料
电脑·
Mathematica
分类介绍
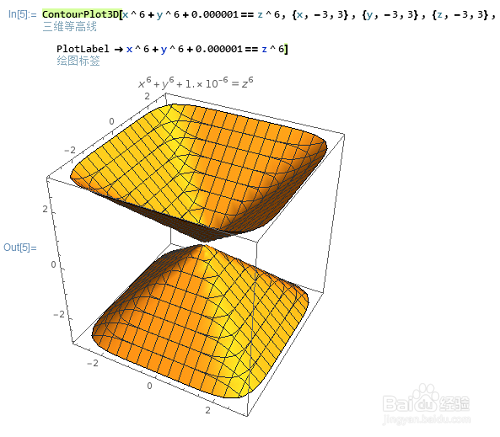
PlotLabe可以指定图形的整体标签:
ContourPlot3D[x^6+ y^6+0.000001== z^6, {x, -3, 3}, {y, -3, 3}, {z, -3, 3}, PlotLabel ->x^6+ y^6+0.000001== z^6]
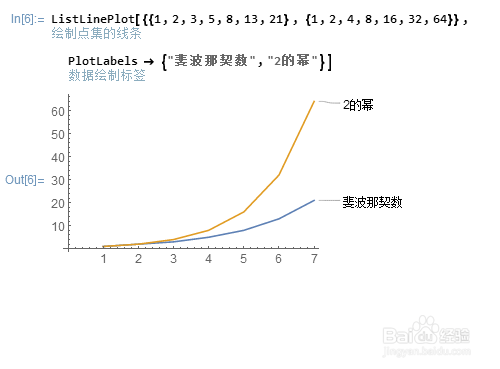
PlotLabels 可以指定不同图像的标签:
ListLinePlot[{{1, 2, 3, 5, 8, 13, 21}, {1, 2, 4, 8, 16, 32, 64}},
PlotLabels -> {"斐波那契数", "2的幂"}]
PlotLegends绘制图形的图例:
LogPlot[{Sin[x^2 + 1], Cos[x^2 + 1]}, {x, 0, \[Pi]},
PlotLegends -> "Expressions"]

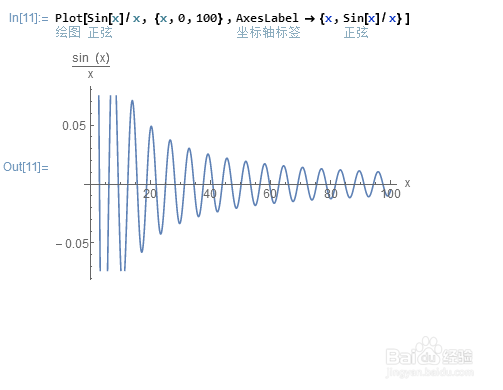
AxesLabel可以指定坐标轴的标签:
Plot[Sin[x]/x, {x, 0, 100}, AxesLabel ->{x, Sin[x]/x}]
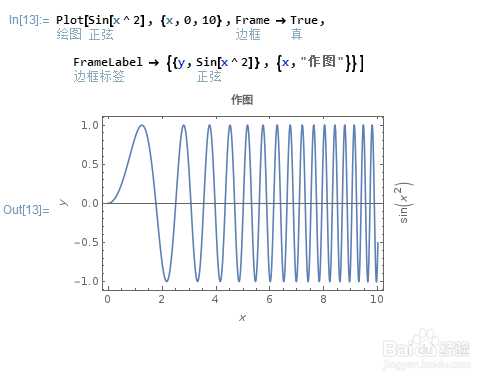
FrameLabel可以指定边框的标签:
Plot[Sin[x^2], {x, 0, 10}, Frame -> True, FrameLabel -> {{y, Sin[x^2]}, {x, "作图"}}]
注意事项
Mathematica里面的各类标签还有很多,大家可以自己慢慢学习!
声明:本网站引用、摘录或转载内容仅供网站访问者交流或参考,不代表本站立场,如存在版权或非法内容,请联系站长删除,联系邮箱:site.kefu@qq.com。
阅读量:132
阅读量:171
阅读量:178
阅读量:120
阅读量:30