NCL绘制台风路径
1、台风路径数据下载
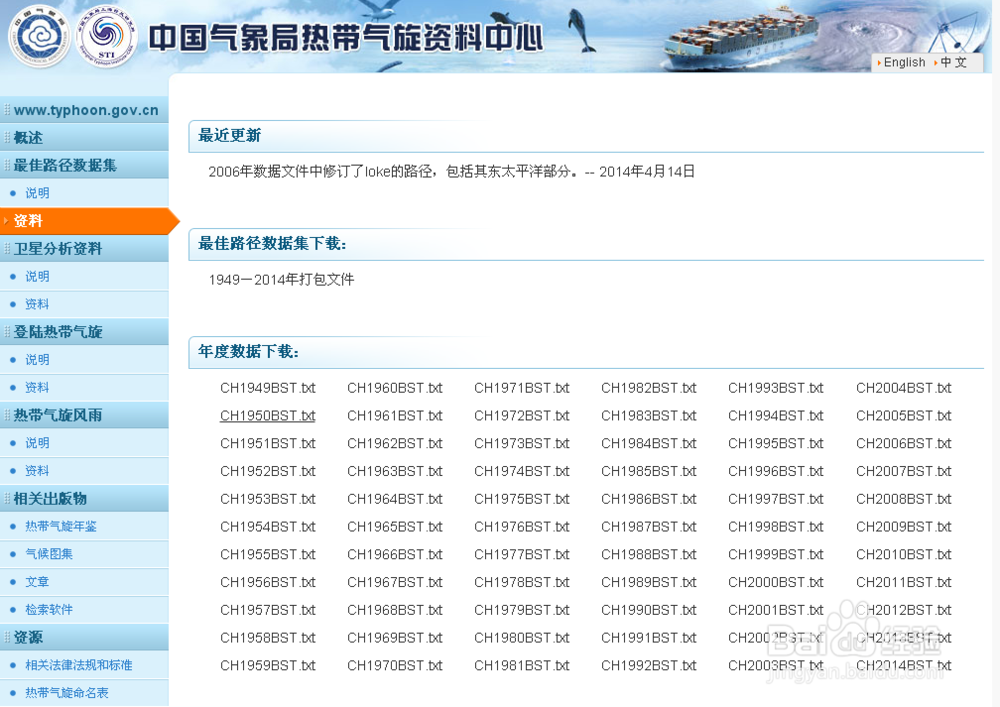
中国气象局热带气旋资料中心(http://tcdata.typhoon.gov.cn/zjljsjj_sm.html)
资料说明和资料下载如图


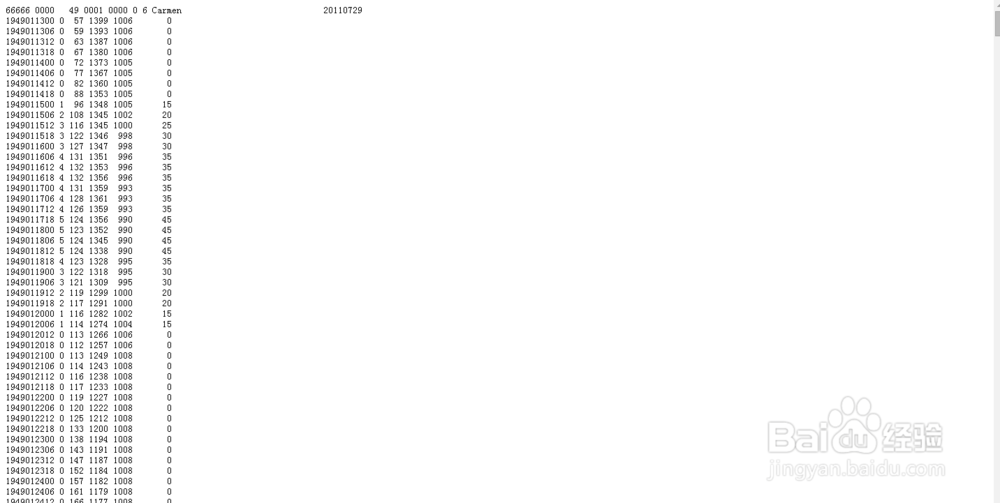
2、打开数据,格式如下,保存为“typhoon.txt”
NCl脚本如下
;********************************************************
; Load NCL scripts
load "$NCARG_ROOT/lib/ncarg/nclscripts/csm/gsn_code.ncl"
load "$NCARG_ROOT/lib/ncarg/nclscripts/csm/gsn_csm.ncl"
load "$NCARG_ROOT/lib/ncarg/nclscripts/csm/contributed.ncl"
;********************************************************
begin
fiTY = "./typhoon.txt"
nrow = numAsciiRow(fiTY)
YYYYMMDDHH = new(nrow, "string")
lat = new(nrow, "float")
lon = new(nrow, "float")
vmax = new(nrow, "integer")
mslp = new(nrow, "integer")
data = asciiread(fiTY, -1, "string")
YYYYMMDDHH = str_get_field(data, 1," ")
lat = stringtofloat(str_get_field(data, 3," "))*0.1
lon = stringtofloat(str_get_field(data, 4, " "))*0.1
mslp = stringtoint(str_get_field(data, 5," " ))
vmax = stringtoint(str_get_field(data, 6, " "))
;print(vmax)
DateChar = stringtochar(YYYYMMDDHH)
MM = chartostring(DateChar(:,4:5))
DD = chartostring(DateChar(:,6:7))
HH = chartostring(DateChar(:,8:9))
HHi = mod(stringtoint(YYYYMMDDHH), 100)
DDi = mod(stringtoint(YYYYMMDDHH)/100, 100)
MMi = mod(stringtoint(YYYYMMDDHH)/10000, 100)
wks = gsn_open_wks("pdf", "suli_track")
gsn_define_colormap(wks,"rainbow")
res = True
res@gsnDraw = False
res@gsnFrame = False
res@mpMinLatF = 10
res@mpMaxLatF = 40
res@mpMinLonF = 112
res@mpMaxLonF = 160
res@mpLandFillColor = 160
res@tmXBLabelFontHeightF = 0.025
res@tmYLLabelFontHeightF = 0.025
res@mpGridAndLimbOn = "True"
res@mpGridMaskMode = "MaskNotOcean"
res@mpGridLineDashPattern = 15
res@mpGridSpacingF = 5.0
res@mpOutlineOn = True
res@mpOutlineBoundarySets = "National"
res@mpDataBaseVersion = "MediumRes"
res@mpDataSetName = "Earth..4"
res@mpOutlineSpecifiers = "China:States"
plot = gsn_csm_map_ce(wks,res)
colours = (/3, 20, 60, 120, 180/)
resDot = True
resLine = True
dumDot= new(nrow, graphic)
dumLine = new(nrow, graphic)
resLine@gsLineThicknessF = 3
do i = 0, nrow-2
xx = (/ lon(i), lon(i+1)/)
yy = (/ lat(i), lat(i+1)/)
if (vmax(i).le.17) then
resLine@gsLineColor = colours(0)
end if
if (vmax(i) .ge. 17 .and. vmax(i).le.32) then
resLine@gsLineColor = colours(1)
end if
if (vmax(i).ge.32 .and. vmax(i) .le. 42) then
resLine@gsLineColor = colours(2)
end if
if (vmax(i).ge.42 .and. vmax(i) .lt. 51) then
resLine@gsLineColor = colours(3)
end if
if (vmax(i).ge.51) then
resLine@gsLineColor = colours(4)
end if
dumLine(i) = gsn_add_polyline(wks, plot, xx, yy, resLine)
end do
resDot@gsMarkerIndex = 1
resDot@gsMarkerColor = "black"
do i = 0, nrow-1
if (HH(i) .eq. "00") then
resDot@gsMarkerSizeF = 0.02
dumDot(i) = gsn_add_polymarker(wks, plot, lon(i), lat(i), resDot)
else
resDot@gsMarkerSizeF = 0.005
dumDot(i) = gsn_add_polymarker(wks, plot, lon(i), lat(i), resDot)
end if
end do
resLg = True
resLg@lgItemType = "MarkLines"
resLg@lgMonoMarkerIndex = True
resLg@lgMarkerColors = colours
resLg@lgMarkerIndex = 1
resLg@lgMarkerSizeF = 0.02
resLg@lgMonoDashIndex = True
resLg@lgDashIndex = 0
resLg@lgLineColors = colours
resLg@lgLineThicknessF = 3
resLg@vpWidthF = 0.14
resLg@vpHeightF = 0.13
resLg@lgPerimFill = 0
resLg@lgPerimFillColor = "Background"
resLg@lgLabelFontHeightF = 0.3
resLg@lgTitleFontHeightF = 0.015
resLg@lgTitleString = "Best Track"
lbid = gsn_create_legend(wks, 5, (/" 17m/s or less"," 17 to 32m/s"," 32 to 42m/s"," 42 to 51m/s"," 51 or more"/), resLg)
amres = True
amres@amParallelPosF = 0.3
amres@amOrthogonalPosF = -0.3
dumLg = gsn_add_annotation(plot, lbid, amres)
dumDate = new(nrow,graphic)
resTx = True
resTx@txFontHeightF = 0.015
resTx@txFontColor = "black"
resTx@txJust = "BottomLeft"
do i = 0, nrow-1
if (HH(i) .ne. "00" ) then
continue
end if
dumDate(i) = gsn_add_text(wks,plot, MM(i)+DD(i), lon(i)+0.5, lat(i), resTx)
end do
draw(wks)
frame(wks)
end


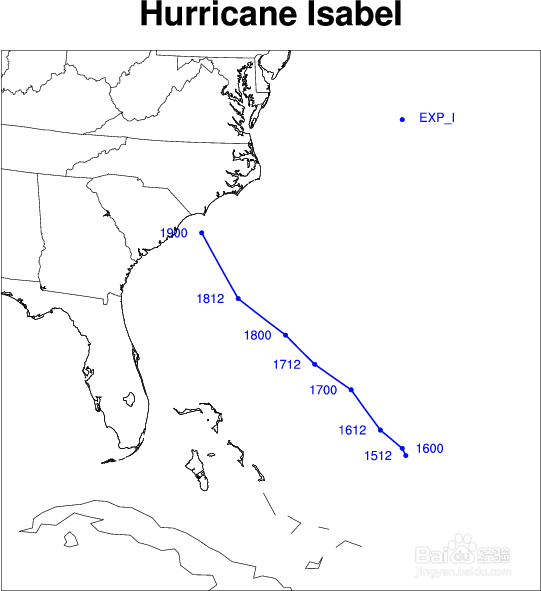
3、如果用WRF输出数据绘制台风路径,得到下图
********************************************************
; Plot storm stracks from wrfout files.
;********************************************************
; ===========================================
load "$NCARG_ROOT/lib/ncarg/nclscripts/csm/gsn_code.ncl"
load "$NCARG_ROOT/lib/ncarg/nclscripts/csm/gsn_csm.ncl"
load "$NCARG_ROOT/lib/ncarg/nclscripts/csm/contributed.ncl"
load "$NCARG_ROOT/lib/ncarg/nclscripts/wrf/WRF_contributed.ncl"
load "$NCARG_ROOT/lib/ncarg/nclscripts/wrf/WRFUserARW.ncl"
begin
; DATES
date = (/1512,1600,1612,1700,1712,1800,1812,1900/)
ndate = dimsizes(date)
sdate = sprinti("%4.0i",date)
; Experiment name (for legend)
EXP = (/"EXP_I"/) ; (/"EXP_I","EXP_II","EXP_III"/)
nexp = dimsizes(EXP)
; To get lat/lon info.
a = addfile("wrfout_d01_2003-07-15_00:00:00.nc","r")
lat2d = a->XLAT(0,:,:)
lon2d = a->XLONG(0,:,:)
dimll = dimsizes(lat2d)
nlat = dimll(0)
mlon = dimll(1)
; Sea Level Pressure
slp = wrf_user_getvar(a,"slp",0)
dims = dimsizes(slp)
; Array for track
time = new(ndate,string)
imin = new(ndate,integer)
jmin = new(ndate,integer)
smin = new(ndate,integer)
; =======
; ndate
; =======
fs = systemfunc("ls wrfout*00")
nfs= dimsizes(fs)
if(nfs .ne. ndate) then
print("Check input data:"+nfs+" .ne. "+ndate)
end if
do ifs=0,nfs-1
f = addfile(fs(ifs)+".nc","r")
time(ifs) = wrf_user_list_times(f)
; print(time(ifs))
slp2d = wrf_user_getvar(f,"slp",0)
; We need to convert 2-D array to 1-D array to find the minima.
slp1d = ndtooned(slp2d)
smin(ifs) = minind(slp1d)
; Convert the index for 1-D array back to the indeces for 2-D array.
minij = ind_resolve(ind(slp1d.eq.min(slp2d)),dims)
imin(ifs) = minij(0,0)
jmin(ifs) = minij(0,1)
; print(time(ifs)+" : "+min(slp2d)+" ("+imin(ifs)+","+jmin(ifs)+")")
end do
;
; Graphics section
wks=gsn_open_wks("ps","track") ; Open PS file.
gsn_define_colormap(wks,"BlGrYeOrReVi200") ; Change color map.
res = True
res@gsnDraw = False ; Turn off draw.
res@gsnFrame = False ; Turn off frame advance.
res@gsnMaximize = True ; Maximize plot in frame.
res@tiMainString = "Hurricane Isabel" ; Main title
WRF_map_c(a,res,0) ; Set up map resources
; (plot options)
plot = gsn_csm_map(wks,res) ; Create a map.
; Set up resources for polymarkers.
gsres = True
gsres@gsMarkerIndex = 16 ; filled dot
;gsres@gsMarkerSizeF = 0.005 ; default - 0.007
cols = (/5,160,40/)
; Set up resources for polylines.
res_lines = True
res_lines@gsLineThicknessF = 3. ; 3x as thick
dot = new(ndate,graphic) ; Make sure each gsn_add_polyxxx call
line = new(ndate,graphic) ; is assigned to a unique variable.
; Loop through each date and add polylines to the plot.
do i = 0,ndate-2
res_lines@gsLineColor = cols(0)
xx=(/lon2d(imin(i),jmin(i)),lon2d(imin(i+1),jmin(i+1))/)
yy=(/lat2d(imin(i),jmin(i)),lat2d(imin(i+1),jmin(i+1))/)
line(i) = gsn_add_polyline(wks,plot,xx,yy,res_lines)
end do
lon1d = ndtooned(lon2d)
lat1d = ndtooned(lat2d)
; Loop through each date and add polymarkers to the plot.
do i = 0,ndate-1
print("dot:"+lon1d(smin(i))+","+lat1d(smin(i)))
gsres@gsMarkerColor = cols(0)
dot(i)=gsn_add_polymarker(wks,plot,lon1d(smin(i)),lat1d(smin(i)),gsres)
end do
; Date (Legend)
txres = True
txres@txFontHeightF = 0.015
txres@txFontColor = cols(0)
txid1 = new(ndate,graphic)
; Loop through each date and draw a text string on the plot.
do i = 0, ndate-1
txres@txJust = "CenterRight"
ix = smin(i) - 4
print("Eye:"+ix)
if(i.eq.1) then
txres@txJust = "CenterLeft"
ix = ix + 8
end if
txid1(i) = gsn_add_text(wks,plot,sdate(i),lon1d(ix),lat1d(ix),txres)
end do
; Add marker and text for legend. (Or you can just use "pmLegend" instead.)
txres@txJust = "CenterLeft"
txid2 = new(nexp,graphic)
pmid2 = new(nexp,graphic)
do i = 0,nexp-1
gsres@gsMarkerColor = cols(i)
txres@txFontColor = cols(i)
ii = ((/129,119,109/)) ; ilat
jj = ((/110,110,110/)) ; jlon
ji = ii*mlon+jj ; col x row
pmid2(i) = gsn_add_polymarker(wks,plot,lon1d(ji(i)),lat1d(ji(i)),gsres)
txid2(i) = gsn_add_text(wks,plot,EXP(i),lon1d(ji(i)+5),lat1d(ji(i)),txres)
end do
draw(plot)
frame(wks)
end
