使用ECharts绑定SQL 2008数据库数据显示图表
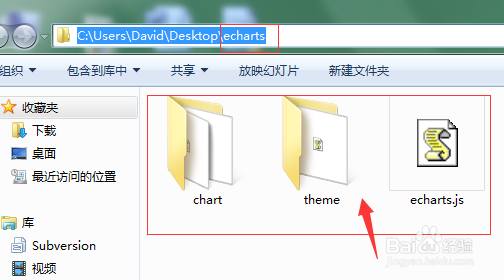
1、打开百度echarts首页,点击下载最新的开发包,下载下来的文件如下图所示:
2、打开SQL Server 2008新建数据库表T_EchartData1,表字段和表数据如下图所示:

3、新建数据库表T_EchartData2,表字段和表数据如下图所示:

4、打开VS2010或VS2012,新建Web页面EchartDemo.aspx及EchartDemo.aspx.cs,核心代码如下:
<script src="../Themes/Scripts/jquery-1.8.2.min.js"></script>
<div id="divEnergy" style="width: 610px; height: 220px;"></div>
<div id="divReport" style="width: 750px; height: 250px;"></div>
<script src="../Themes/Scripts/echarts/echarts.js"></script>
<script src="../Themes/Scripts/echarts/theme/macarons.js"></script>
<script type="text/javascript">
var cityClick = '';
function GetUnitEnergy(unitName) {
GetCityEnergy(unitName, 2);
}
require.config({
paths: {
echarts: '../Themes/Scripts/echarts'
}
});
require(
[
'echarts',
'echarts/chart/bar',
'echarts/chart/line',
'echarts/chart/pie',
'echarts/chart/funnel'
],
DrawEChart //异步加载的回调函数绘制图表
);
var myEnergyChart;
var myReportChart;
//创建ECharts图表方法
function DrawEChart(ec) {
//--- 折柱 ---
myEnergyChart = ec.init(document.getElementById('divEnergy'), macarons);
//定义图表options
var options = {
title: {
text: "",
subtext: ""
},
tooltip: {
trigger: 'axis'
},
legend: {
data: [" "]
},
toolbox: {
show: true,
feature: {
mark: { show: false },
dataView: { show: false, readOnly: false },
magicType: { show: true, type: ['line', 'bar'] },
restore: { show: true },
saveAsImage: { show: false }
}
},
grid: {
x: 60,
y: 30,
x2: 5,
y2: 30
},
calculable: true,
xAxis: [
{
type: 'category',
data: [" "]
}
],
yAxis: [
{
type: 'value',
axisLabel: {
fomatter: "."
},
splitArea: { show: true }
}
],
series: [{
name: " ",
type: "line",
data: [0]
}]
};
//选择一个空图表
myEnergyChart.setOption(options);
myReportChart = ec.init(document.getElementById('divReport'), macarons);
//选择一个空图表
myReportChart.setOption(options);
// 默认加载填报
GetReport("1");
// 默认加载省直
GetUnitEnergy('34');
}
function GetCityEnergy(cityCode, level) {
//获得图表的options对象
var options = myEnergyChart.getOption();
//通过Ajax获取数据
$.ajax({
type: "post",
async: false, //同步执行
url: "GetChartData.aspx?type=energyData",
dataType: "json", //返回数据形式为json
success: function (result) {
if (result) {
options.xAxis[0].data = result.category;
options.series = result.series;
options.legend.data = result.legend;
myEnergyChart.setOption(options);
myEnergyChart.refresh();
}
},
error: function (errorMsg) {
alert("图表数据加载失败!");
}
});
}
///点击按钮获取图表数据采用ajax方式
function GetReport(code) {
//获得图表的options对象
var options = myReportChart.getOption();
//通过Ajax获取数据
$.ajax({
type: "post",
async: false, //同步执行
url: "GetChartData.aspx?type=reportData",
dataType: "json", //返回数据形式为json
success: function (result) {
if (result) {
options.xAxis[0].data = result.category;
options.series = result.series;
options.legend.data = result.legend;
myReportChart.setOption(options);
}
},
error: function (errorMsg) {
alert("图表数据加载失败!");
}
});
}
//初始加载图表数据
$(function () {
GetCityEnergy("", "");
GetUnitEnergy("");
});
</script>
5、新建Web页面GetChartData.aspx及GetChartData.aspx.cs,用于从数据库获取数据,代码如下:
protected void Page_Load(object sender, EventArgs e)
{
string type = Request["type"];
if (!string.IsNullOrEmpty(type))
{
switch (type)
{
case "energyData":
GetEnergyDataAjaxData("", "");
break;
case "reportData":
GetReportDataAjaxData("");
break;
}
}
}
private void GetEnergyDataAjaxData(string level, string code)
{
List<string> categoryList = new List<string>();
List<Series> seriesList = new List<Series>();
List<string> legendList = new List<string>();
DataTable dt = null;
using (SqlConnection con = new SqlConnection("Data Source=.;User ID=sa;Password=111111;Database=XXXXX;"))
{
string strSQL = "select top 12 * from T_EchartData1";
using (SqlDataAdapter adapter = new SqlDataAdapter(strSQL, con))
{
DataSet ds = new DataSet();
adapter.Fill(ds);
dt = ds.Tables[0];
}
}
legendList.Add("今年能耗");
legendList.Add("去年能耗");
Series thisSeriesObj = new Series();
thisSeriesObj.id = 0;
thisSeriesObj.name = "今年能耗";
thisSeriesObj.type = "line"; //线性图呈现
thisSeriesObj.data = new List<object>();
thisSeriesObj.itemStyle = new itemStyle { normal = new normal { color = "#0099FF" } };
Series lastSeriesObj = new Series();
lastSeriesObj.id = 1;
lastSeriesObj.name = "去年能耗";
lastSeriesObj.type = "line"; //线性图呈现
lastSeriesObj.data = new List<object>();
lastSeriesObj.itemStyle = new itemStyle { normal = new normal { color = "#00CC00" } };
foreach (DataRow dr in dt.Rows)
{
categoryList.Add(dr[0].ToString() + "月");
thisSeriesObj.data.Add(dr[1]);
lastSeriesObj.data.Add(dr[2]);
}
seriesList.Add(thisSeriesObj);
seriesList.Add(lastSeriesObj);
var newObj = new
{
category = categoryList,
series = seriesList,
legend = legendList
};
Response.Write(JsonConvert.SerializeObject(newObj, Formatting.None));
Response.End();
}
private void GetReportDataAjaxData(string code)
{
List<string> categoryList = new List<string>();
List<Series> seriesList = new List<Series>();
List<string> legendList = new List<string>();
DataTable dt = null;
using (SqlConnection con = new SqlConnection("Data Source=.;User ID=sa;Password=111111;Database=AT_DB;"))
{
string strSQL = "select * from T_EchartData2";
using (SqlDataAdapter adapter = new SqlDataAdapter(strSQL, con))
{
DataSet ds = new DataSet();
adapter.Fill(ds);
dt = ds.Tables[0];
}
}
//设置legend数组
legendList.Add("电");
legendList.Add("水");
legendList.Add("燃煤");
legendList.Add("天然气");
legendList.Add("汽油");
legendList.Add("柴油");
legendList.Add("热力");
legendList.Add("其他");
Series dianSeries = new Series();
dianSeries.id = 0;
dianSeries.name = "电";
dianSeries.type = "line"; //线性图呈现
dianSeries.data = new List<object>();
dianSeries.itemStyle = new itemStyle { normal = new normal { color = "#0099FF" } };
Series shuiSeries = new Series();
shuiSeries.id = 1;
shuiSeries.name = "水";
shuiSeries.type = "line"; //线性图呈现
shuiSeries.data = new List<object>();
shuiSeries.itemStyle = new itemStyle { normal = new normal { color = "#00CC00" } };
Series yuanmeiSeries = new Series();
yuanmeiSeries.id = 2;
yuanmeiSeries.name = "燃煤";
yuanmeiSeries.type = "line"; //线性图呈现
yuanmeiSeries.data = new List<object>();
yuanmeiSeries.itemStyle = new itemStyle { normal = new normal { color = "#008080" } };
Series tianranqiSeries = new Series();
tianranqiSeries.id = 3;
tianranqiSeries.name = "天然气";
tianranqiSeries.type = "line"; //线性图呈现
tianranqiSeries.data = new List<object>();
tianranqiSeries.itemStyle = new itemStyle { normal = new normal { color = "#CC6600" } };
Series qiyouSeries = new Series();
qiyouSeries.id = 4;
qiyouSeries.name = "汽油";
qiyouSeries.type = "line"; //线性图呈现
qiyouSeries.data = new List<object>();
qiyouSeries.itemStyle = new itemStyle { normal = new normal { color = "#CC00CC" } };
Series chaiyouSeries = new Series();
chaiyouSeries.id = 5;
chaiyouSeries.name = "柴油";
chaiyouSeries.type = "line"; //线性图呈现
chaiyouSeries.data = new List<object>();
chaiyouSeries.itemStyle = new itemStyle { normal = new normal { color = "#0033CC" } };
Series reliSeries = new Series();
reliSeries.id = 6;
reliSeries.name = "热力";
reliSeries.type = "line"; //线性图呈现
reliSeries.data = new List<object>();
reliSeries.itemStyle = new itemStyle { normal = new normal { color = "#003300" } };
Series qitaSeries = new Series();
qitaSeries.id = 7;
qitaSeries.name = "其他";
qitaSeries.type = "line"; //线性图呈现
qitaSeries.data = new List<object>();
qitaSeries.itemStyle = new itemStyle { normal = new normal { color = "#FF0000" } };
foreach (DataRow dr in dt.Rows)
{
categoryList.Add(string.Format("{0}年{1}月", dr["ReportYear"], dr["ReportMonth"]));
dianSeries.data.Add(string.IsNullOrEmpty(dr["DIAN"].ToString()) ? 0 : dr["DIAN"]);
shuiSeries.data.Add(string.IsNullOrEmpty(dr["SHUI"].ToString()) ? 0 : dr["SHUI"]);
yuanmeiSeries.data.Add(string.IsNullOrEmpty(dr["YUANMEI"].ToString()) ? 0 : dr["YUANMEI"]);
tianranqiSeries.data.Add(string.IsNullOrEmpty(dr["TIANRQ"].ToString()) ? 0 : dr["TIANRQ"]);
qiyouSeries.data.Add(string.IsNullOrEmpty(dr["QIYOU"].ToString()) ? 0 : dr["QIYOU"]);
chaiyouSeries.data.Add(string.IsNullOrEmpty(dr["CHAIYOU"].ToString()) ? 0 : dr["CHAIYOU"]);
reliSeries.data.Add(string.IsNullOrEmpty(dr["RELI"].ToString()) ? 0 : dr["RELI"]);
qitaSeries.data.Add(string.IsNullOrEmpty(dr["QTNY"].ToString()) ? 0 : dr["QTNY"]);
}
//将sereis对象压入sereis数组列表内
seriesList.Add(dianSeries);
seriesList.Add(shuiSeries);
seriesList.Add(yuanmeiSeries);
seriesList.Add(tianranqiSeries);
seriesList.Add(qiyouSeries);
seriesList.Add(chaiyouSeries);
seriesList.Add(reliSeries);
seriesList.Add(qitaSeries);
//因为我们需要返回category和series、legend多个对象 这里我们自己在new一个新的对象来封装这两个对象
var newObj = new
{
category = categoryList,
series = seriesList,
legend = legendList
};
//Response返回新对象的json数据
Response.Write(JsonConvert.SerializeObject(newObj, Formatting.None));
Response.End();
}
}
/// <summary>
/// 定义一个Series类 设置其每一组sereis的一些基本属性
/// </summary>
class Series
{
/// <summary>
/// sereis序列组id
/// </summary>
public int id
{
get;
set;
}
/// <summary>
/// series序列组名称
/// </summary>
public string name
{
get;
set;
}
/// <summary>
/// series序列组呈现图表类型(line、column、bar等)
/// </summary>
public string type
{
get;
set;
}
/// <summary>
/// series序列组的itemstyle
/// </summary>
public object itemStyle
{
get;
set;
}
/// <summary>
/// series序列组的数据为数据类型数组
/// </summary>
public List<object> data
{
get;
set;
}
}
class normal
{
/// <summary>
/// color
/// </summary>
public string color
{
get;
set;
}
}
class itemStyle
{
/// <summary>
/// normal
/// </summary>
public object normal
{
get;
set;
}
6、系统在VS目录下的结构如下图所示:

7、右键“EchartDemo.aspx”,选择“在浏览器中查看”,如下图所示:

8、默认显示“能耗动态”,运行效果如下图所示:
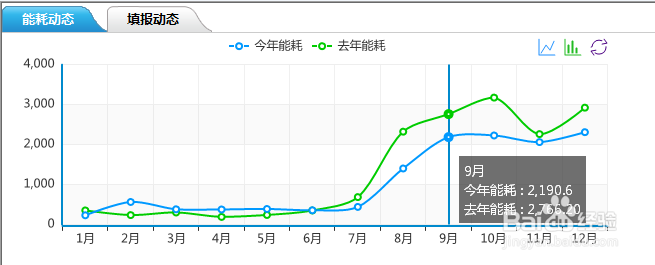
9、点击Tab切换到“填报动态”,运行效果如下图所示:
