MATLAB两种方式绘制圆
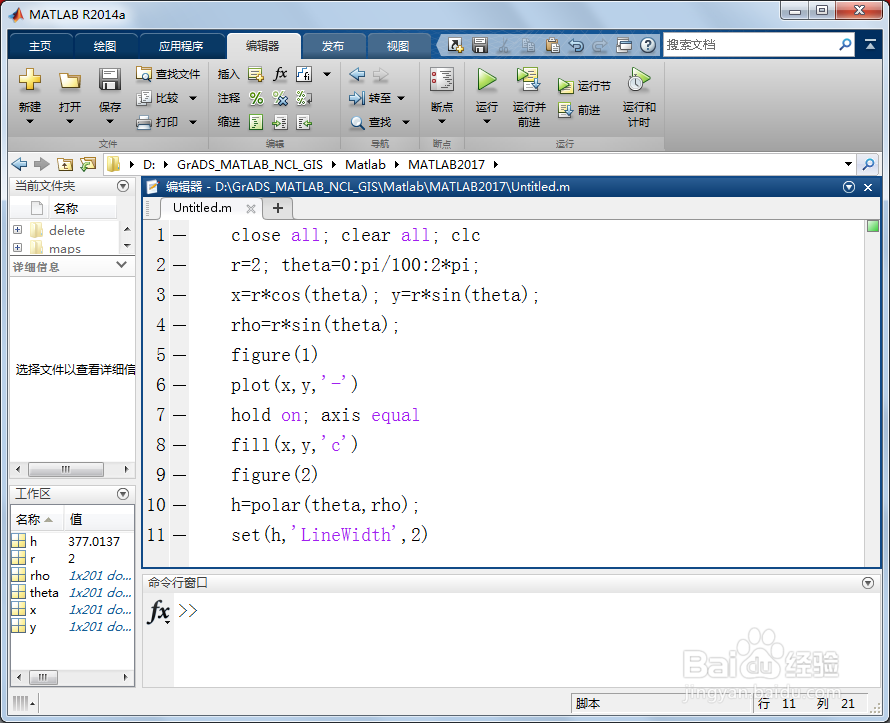
1、第一,启动MATLAB,新建脚本(Ctrl+N),输入以下代码:
close all; clear all; clc
r=2; theta=0:pi/100:2*pi;
x=r*cos(theta); y=r*sin(theta);
rho=r*sin(theta);
figure(1)
plot(x,y,'-')
hold on; axis equal
fill(x,y,'c')
figure(2)
h=polar(theta,rho);
set(h,'LineWidth',2)
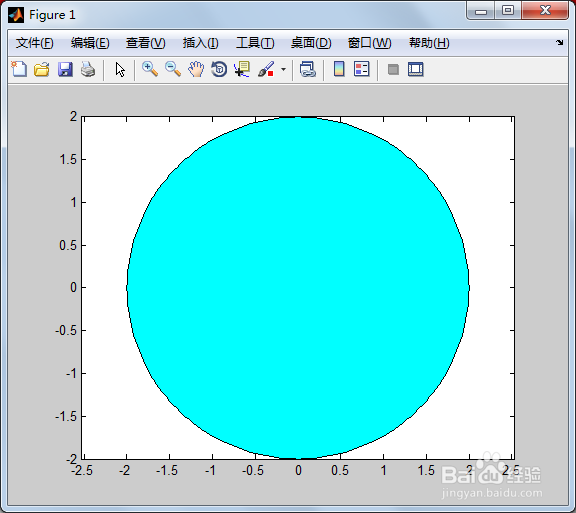
2、第二,保存和运行上述脚本,在figure(1)中得到plot(x,y)和fill(x,y)绘制的圆。
3、第三,保存和运行上述脚本,在figure(2)中得到polar(theta,rho)绘制的圆。

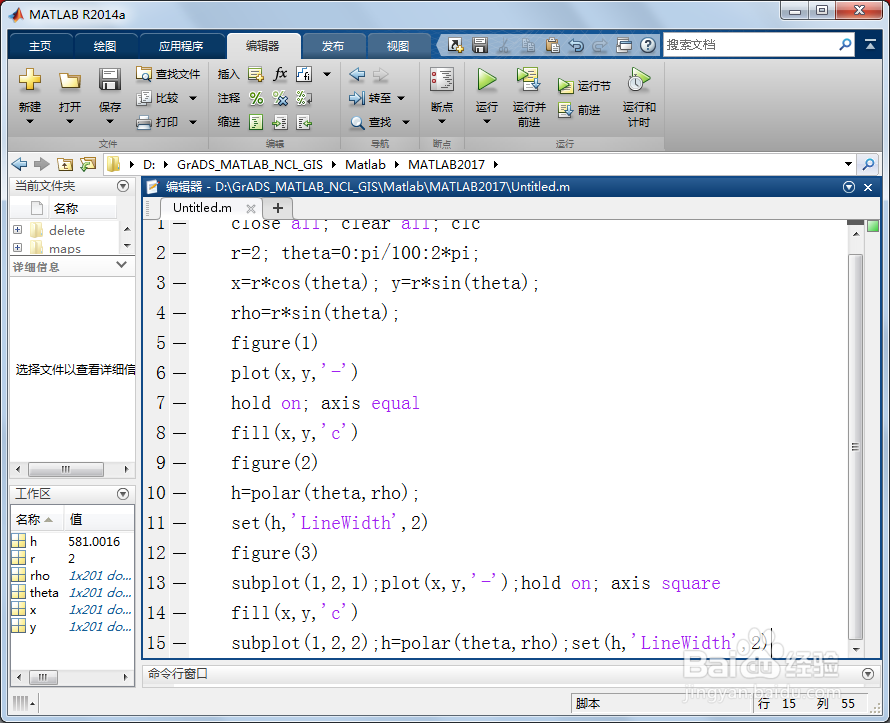
4、第四,可以将plot(x,y),polar(x,y)绘制的圆画在一张图上,只需要接着输入以下代码:
figure(3)
subplot(1,2,1);plot(x,y,'-');hold on; axis square
fill(x,y,'c')
subplot(1,2,2);h=polar(theta,rho);set(h,'LineWidth',2)
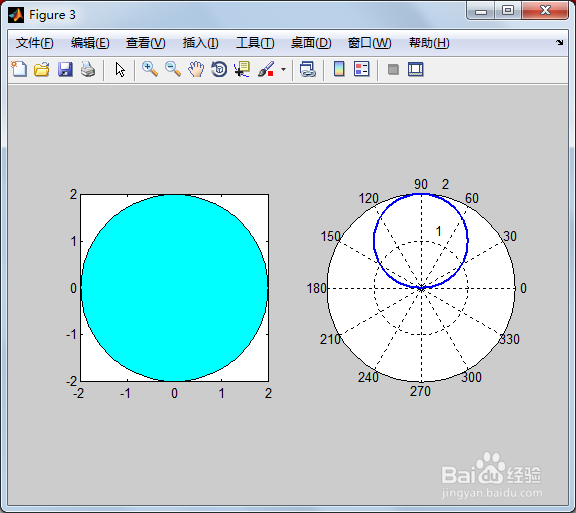
5、第五,保存和运行上述增加后的脚本,在figure(3)中将plot(x,y),polar(x,y)绘制的圆画在了一张图上。
声明:本网站引用、摘录或转载内容仅供网站访问者交流或参考,不代表本站立场,如存在版权或非法内容,请联系站长删除,联系邮箱:site.kefu@qq.com。
阅读量:23
阅读量:140
阅读量:193
阅读量:185
阅读量:60