python创建xlsx
1、import xlrd,xlwt,xlsxwriter
from xlutils.copy import copy
from datetime import date,datetime
import sys
reload(sys)
sys.setdefaultencoding('utf-8')

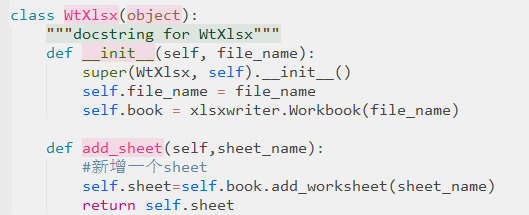
2、class WtXlsx(object):
"""docstring for WtXlsx"""
def __init__(self, file_name):
super(WtXlsx, self).__init__()
self.file_name = file_name
self.book = xlsxwriter.Workbook(file_name)
def add_sheet(self,sheet_name):
#新增一个sheet
self.sheet=self.book.add_worksheet(sheet_name)
return self.sheet
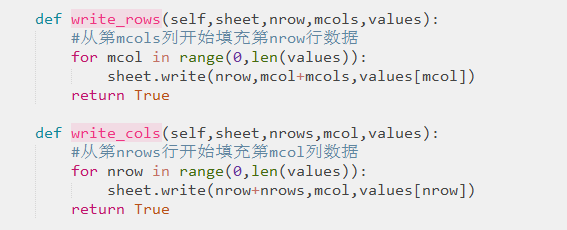
3、def write_rows(self,sheet,nrow,mcols,values):
#从第mcols列开始填充第nrow行数据
for mcol in range(0,len(values)):
sheet.write(nrow,mcol+mcols,values[mcol])
return True
def write_cols(self,sheet,nrows,mcol,values):
#从第nrows行开始填充第mcol列数据
for nrow in range(0,len(values)):
sheet.write(nrow+nrows,mcol,values[nrow])
return True
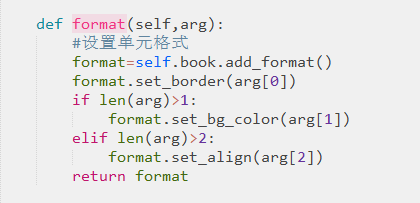
4、def format(self,arg):
#设置单元格式
format=self.book.add_format()
format.set_border(arg[0])
if len(arg)>1:
format.set_bg_color(arg[1])
elif len(arg)>2:
format.set_align(arg[2])
return format
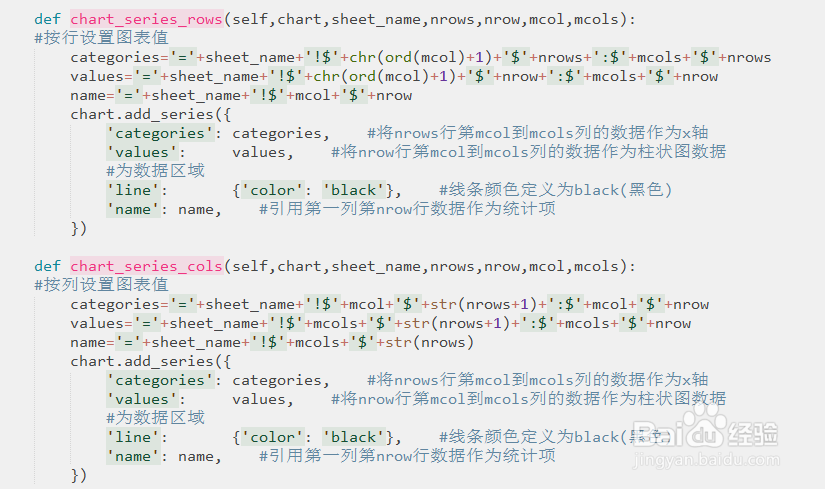
5、def chart_series_rows(self,chart,sheet_name,nrows,nrow,mcol,mcols):
#按行设置图表值
categories='='+sheet_name+'!$'+chr(ord(mcol)+1)+'$'+nrows+':$'+mcols+'$'+nrows
values='='+sheet_name+'!$'+chr(ord(mcol)+1)+'$'+nrow+':$'+mcols+'$'+nrow
name='='+sheet_name+'!$'+mcol+'$'+nrow
chart.add_series({
'categories': categories, #将nrows行第mcol到mcols列的数据作为x轴
'values': values, #将nrow行第mcol到mcols列的数据作为柱状图数据
#为数据区域
'line': {'color': 'black'}, #线条颜色定义为black(黑色)
'name': name, #引用第一列第nrow行数据作为统计项
})
def chart_series_cols(self,chart,sheet_name,nrows,nrow,mcol,mcols):
#按列设置图表值
categories='='+sheet_name+'!$'+mcol+'$'+str(nrows+1)+':$'+mcol+'$'+nrow
values='='+sheet_name+'!$'+mcols+'$'+str(nrows+1)+':$'+mcols+'$'+nrow
name='='+sheet_name+'!$'+mcols+'$'+str(nrows)
chart.add_series({
'categories': categories, #将nrows行第mcol到mcols列的数据作为x轴
'values': values, #将nrow行第mcol到mcols列的数据作为柱状图数据
#为数据区域
'line': {'color': 'black'}, #线条颜色定义为black(黑色)
'name': name, #引用第一列第nrow行数据作为统计项
})
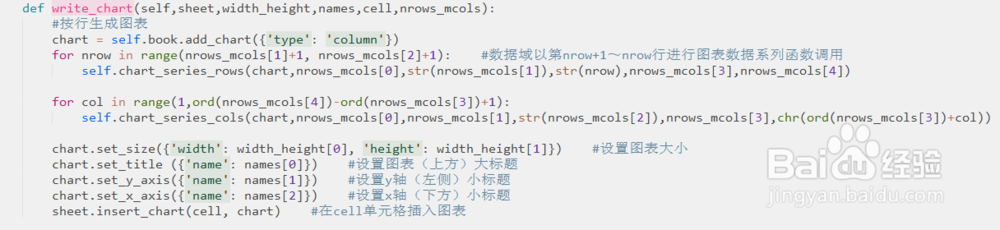
6、def write_chart(self,sheet,width_height,names,cell,nrows_mcols):
#按行生成图表
chart = self.book.add_chart({'type': 'column'})
for nrow in range(nrows_mcols[1]+1, nrows_mcols[2]+1): #数据域以第nrow+1~nrow行进行图表数据系列函数调用
self.chart_series_rows(chart,nrows_mcols[0],str(nrows_mcols[1]),str(nrow),nrows_mcols[3],nrows_mcols[4])
for col in range(1,ord(nrows_mcols[4])-ord(nrows_mcols[3])+1):
self.chart_series_cols(chart,nrows_mcols[0],nrows_mcols[1],str(nrows_mcols[2]),nrows_mcols[3],chr(ord(nrows_mcols[3])+col))
chart.set_size({'width': width_height[0], 'height': width_height[1]}) #设置图表大小
chart.set_title ({'name': names[0]}) #设置图表(上方)大标题
chart.set_y_axis({'name': names[1]}) #设置y轴(左侧)小标题
chart.set_x_axis({'name': names[2]}) #设置x轴(下方)小标题
sheet.insert_chart(cell, chart) #在cell单元格插入图表
7、def save_file(self):
#关闭操作的xlsx
self.book.close()