用matplotlib画函数图像(python3.6)
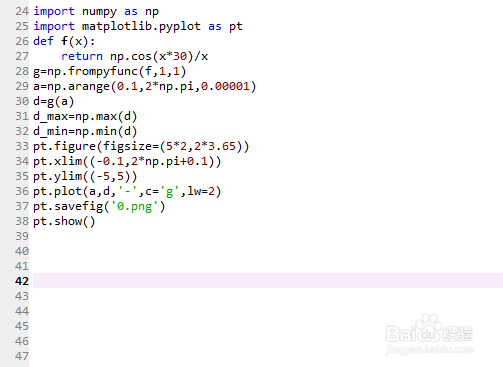
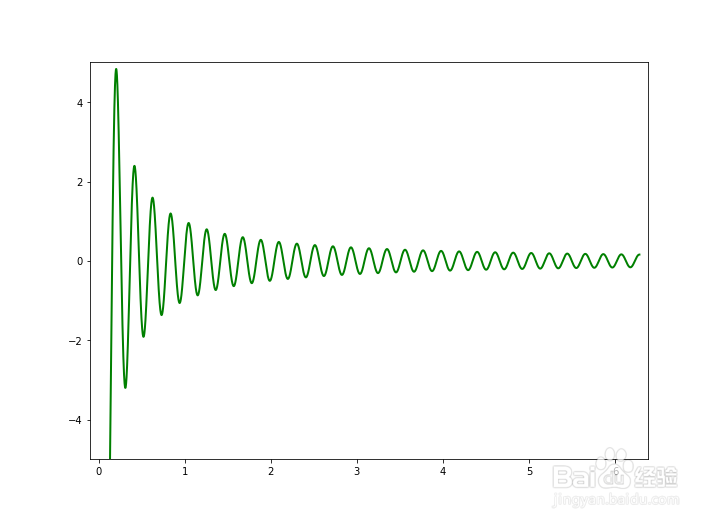
1、显函数图像:y=np.cos(x*30)/x。
import numpy as np
import matplotlib.pyplot as pt
def f(x):
return np.cos(x*30)/x
g=np.frompyfunc(f,1,1)
'''
把函数赋予ufunc属性,并记为g,接收一个参数,并返回一个参数。
'''
a=np.arange(0.1,2*np.pi,0.00001)
d=g(a)
d_max=np.max(d)
d_min=np.min(d)
pt.figure(figsize=(5*2,2*3.65))
pt.xlim((-0.1,2*np.pi+0.1))
pt.ylim((-5,5))
pt.plot(a,d,'-',c='g',lw=2)
pt.savefig('0.png')
pt.show()
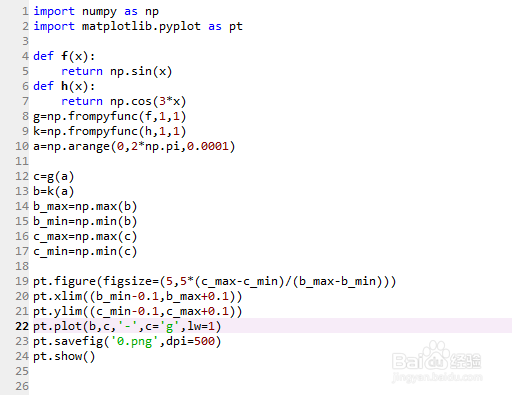
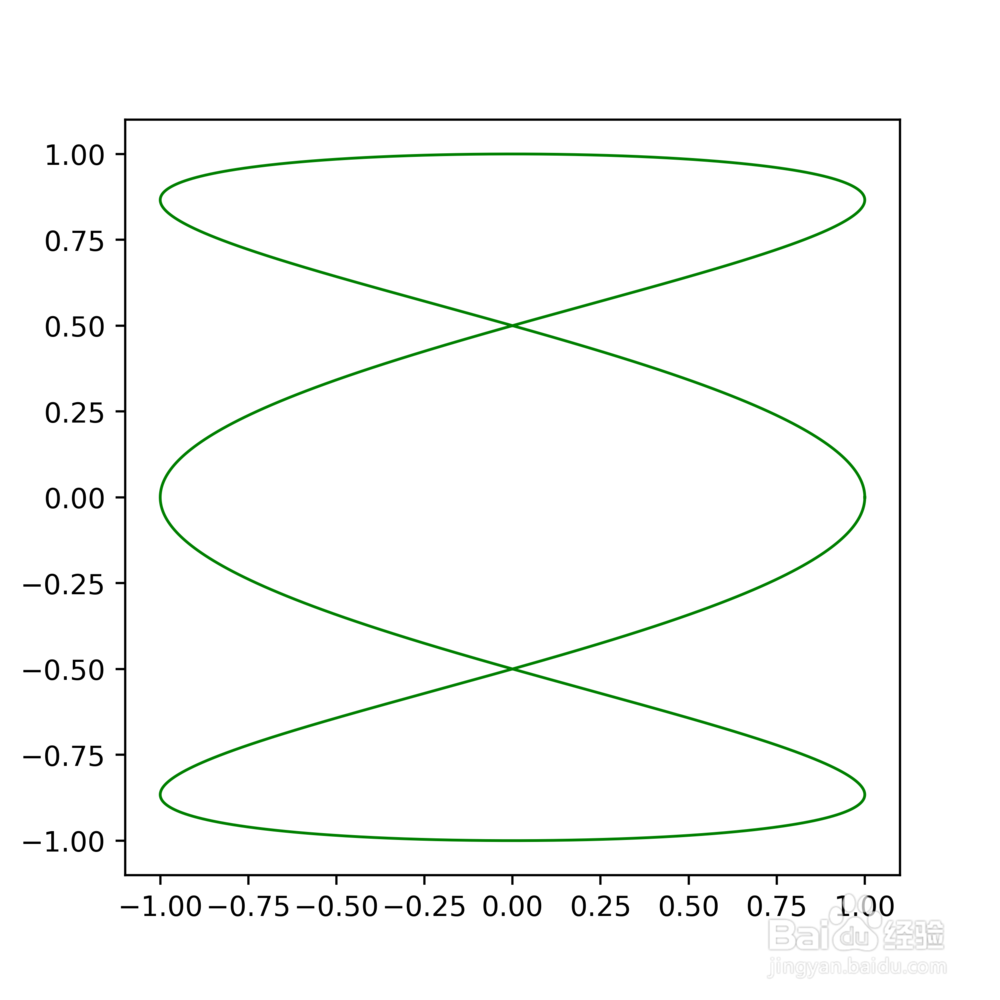
2、参数方程的图像:
x=sin(t)
y=cos(3*t)
代码如下图所示。
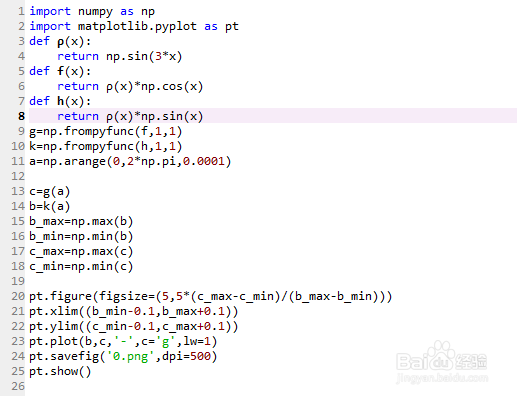
3、极坐标方程的图像:
ρ=sin(3*t)
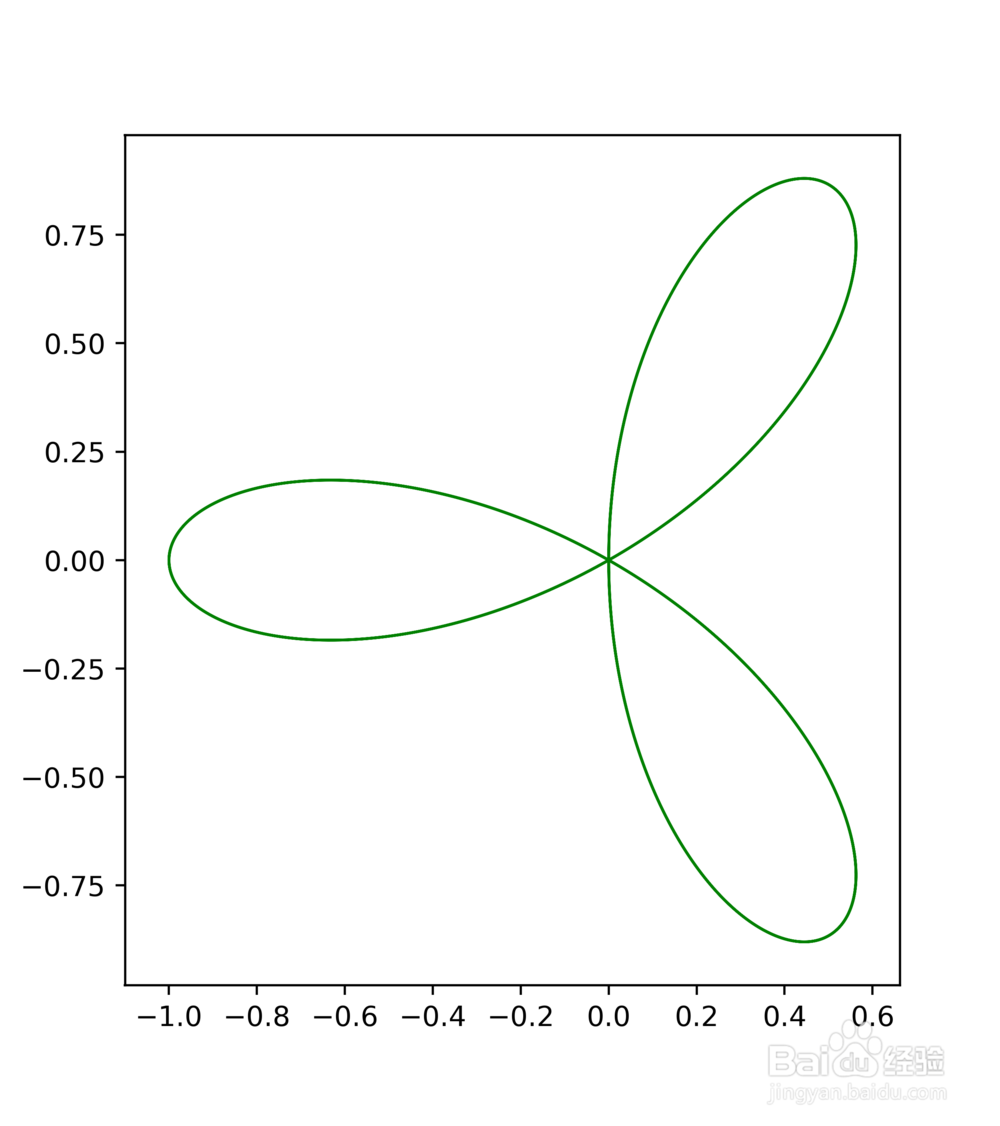
4、极坐标方程:ρ=sin(3*x)+cos(6*x)+2。
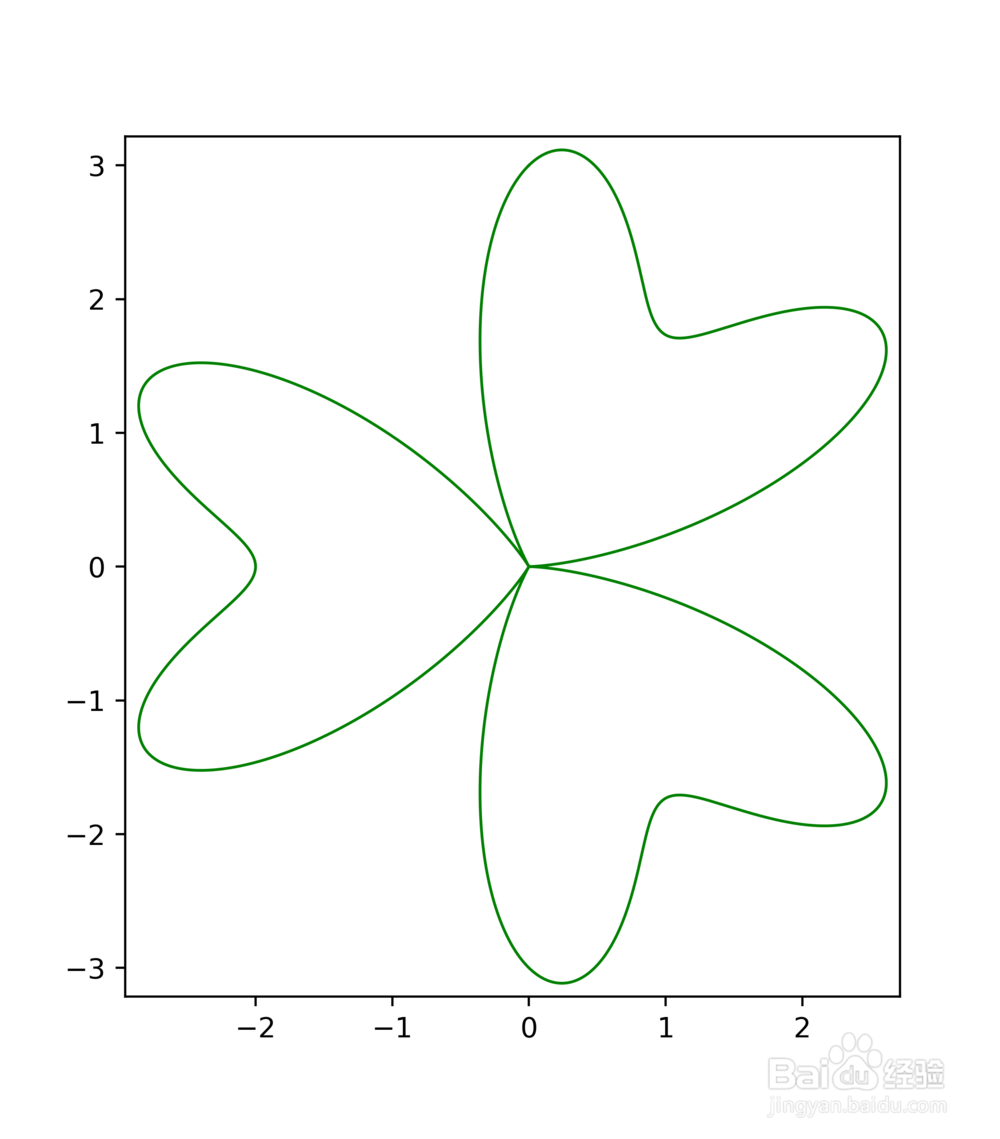
5、ρ=sin(3*x)+cos(9*x)+2
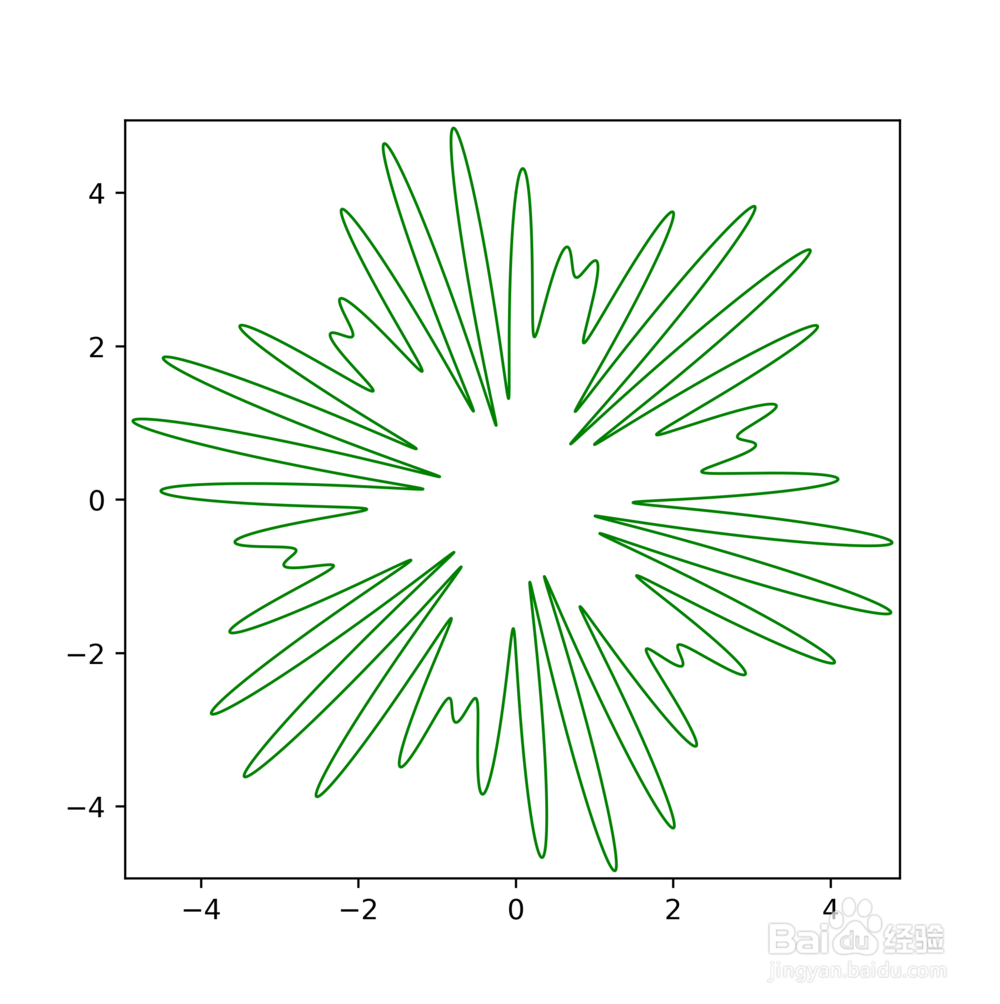
6、ρ=cos(37*x)+sin(31*x)+3
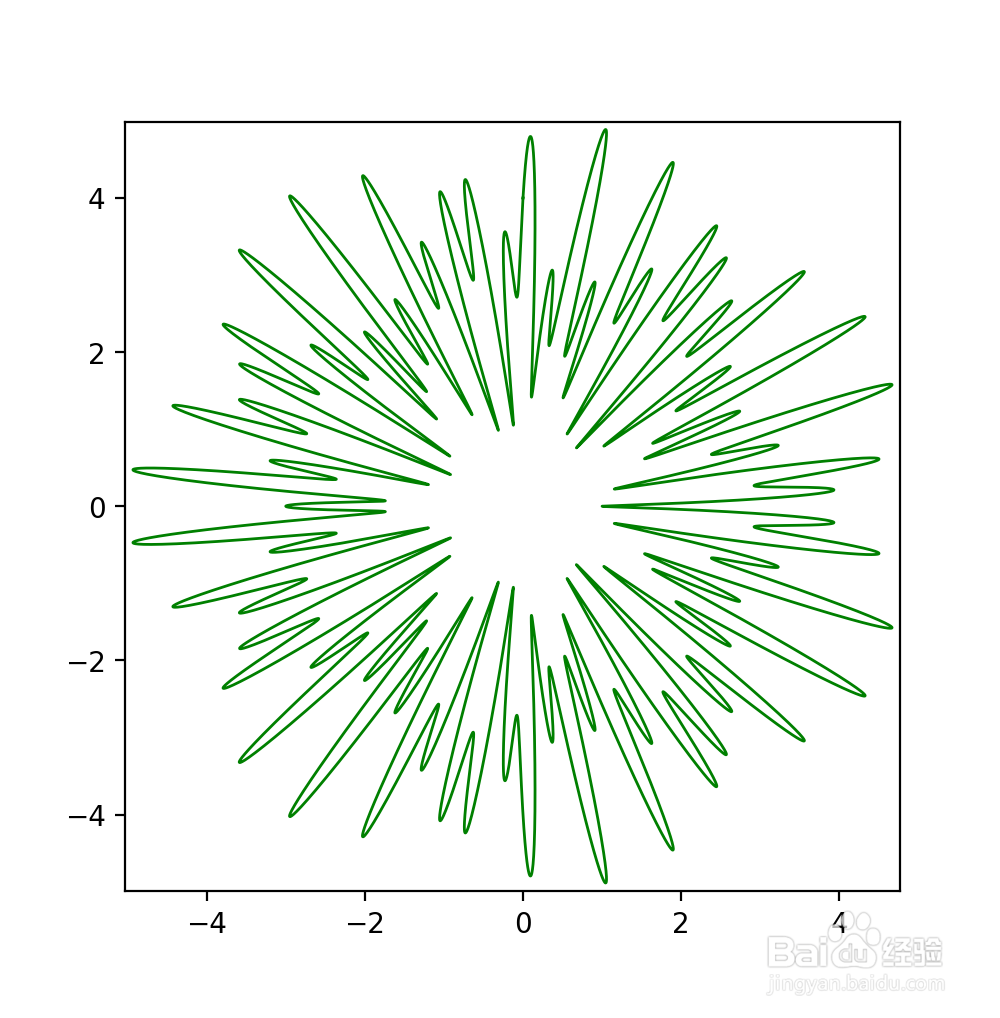
7、cos(30*x)+sin(67*x)+3
声明:本网站引用、摘录或转载内容仅供网站访问者交流或参考,不代表本站立场,如存在版权或非法内容,请联系站长删除,联系邮箱:site.kefu@qq.com。
阅读量:143
阅读量:27
阅读量:71
阅读量:89
阅读量:164