matlab四维图绘制
1、打开matlab 最好是版本高点的,画出来的图好看点。新建脚本文件

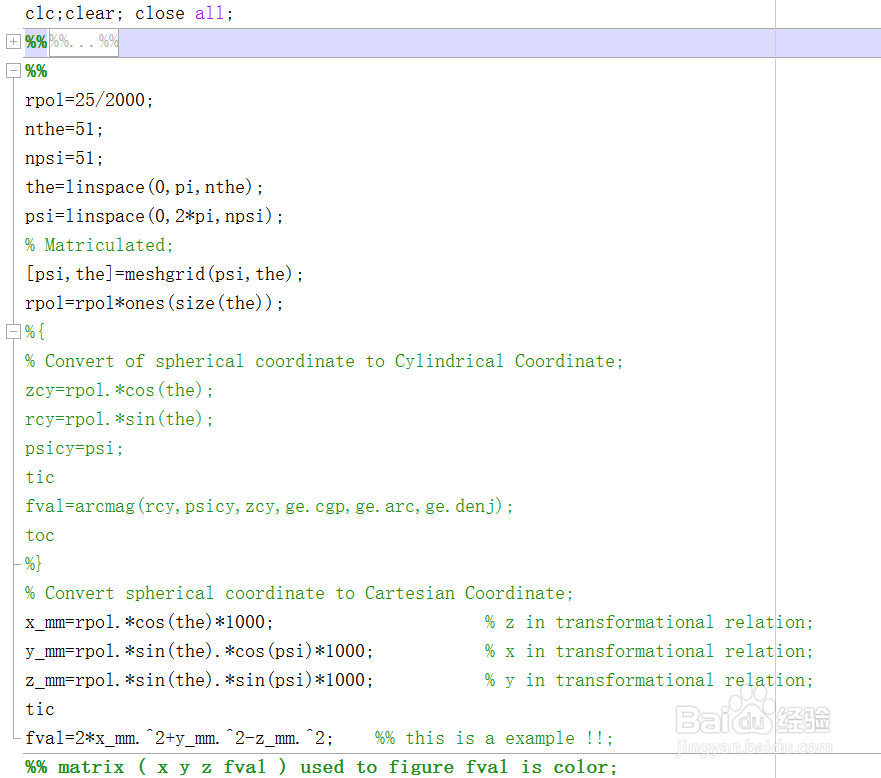
2、构造x,y,z,f(x,y,z)这4个矩阵,如果有的话就不用构建了,或者可以按下图写一下。当然可以直接用sphere命令来构建x,y,z。
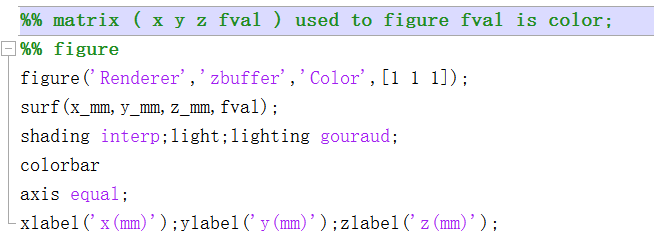
3、然后就可以用surf作图啦,直接用以下命令就可以得到结果,figure中有很多选项可以自定义,surf绘图之后,用shading interp;light;lighting gouraud;命令可以得到光滑好看的图!
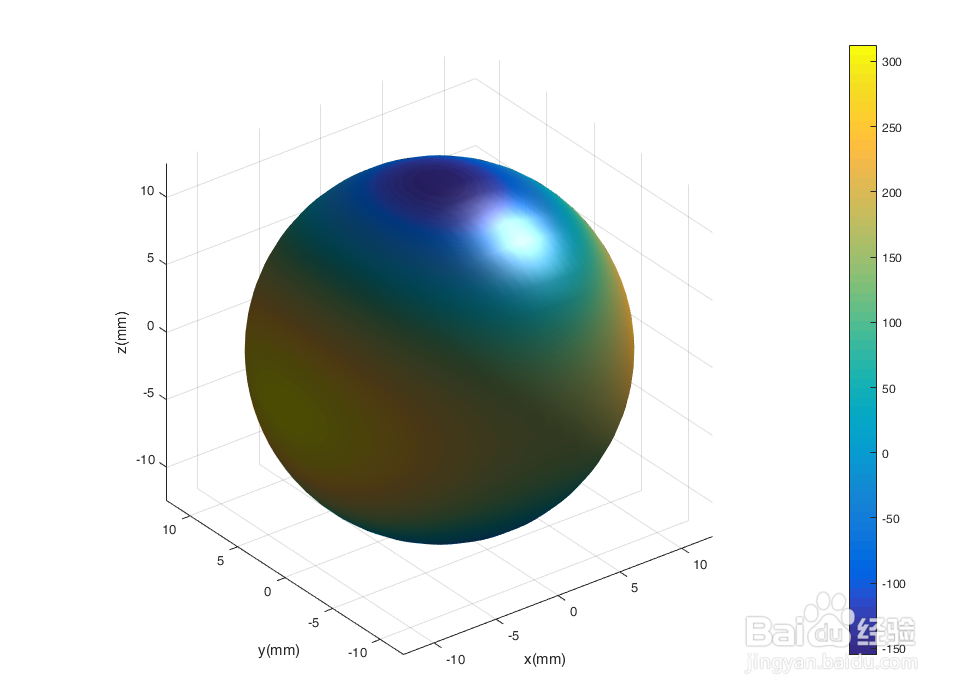
4、使用上述命令得到了如下所示的图形,效果不错的样子!使用surf可以绘制一些特殊的4维图,其中的关键是Cdata项的值,它决定了色彩是如何变化的。
5、附:整个程序的代码如下:
clc;clear; close all;
rpol=25/2000;
nthe=51;
npsi=51;
the=linspace(0,pi,nthe);
psi=linspace(0,2*pi,npsi);
% Matriculated;
[psi,the]=meshgrid(psi,the);
rpol=rpol*ones(size(the));
% Convert spherical coordinate to Cartesian Coordinate;
x_mm=rpol.*cos(the)*1000; % z in transformational relation;
y_mm=rpol.*sin(the).*cos(psi)*1000; % x in transformational relation;
z_mm=rpol.*sin(the).*sin(psi)*1000; % y in transformational relation;
tic
fval=2*x_mm.^2+y_mm.^2-z_mm.^2; %% this is a example !!;
toc
%% matrix ( x y z fval ) used to figure fval is color;
%% figure
figure('Renderer','zbuffer','Color',[1 1 1]);
surf(x_mm,y_mm,z_mm,fval);
shading interp;light;lighting gouraud;
colorbar
axis equal;
xlabel('x(mm)');ylabel('y(mm)');zlabel('z(mm)');