matlab C均值聚类算法FCM用图像分割的彻底解析
1、首先,你要知道什么是C均值聚类算法,就是那个公式,你最好要能推出来,其次,要明白matlab中自带FCM 的代码含义 ,在命令窗中输入 edit fcm; 会在M文件中打开,前面是注释
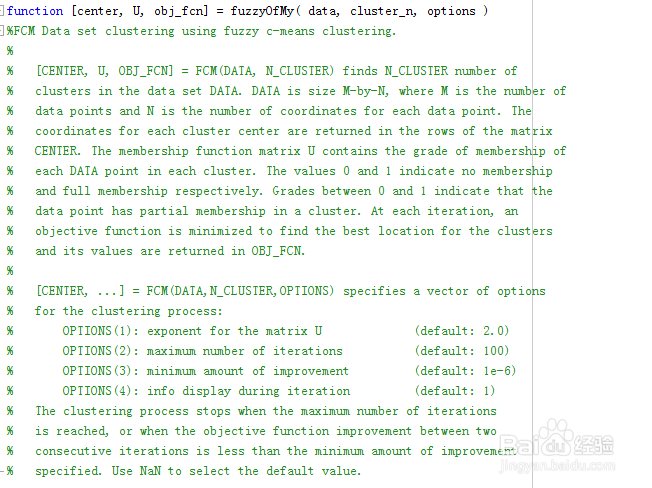
function [center, U, obj_fcn] = fcm(data, cluster_n, options)
%FCM Data set clustering using fuzzy c-means clustering.
%% [CENTER, U, OBJ_FCN] = FCM(DATA, N_CLUSTER) finds
N_CLUSTER number of
% clusters in the data set DATA. DATA is size M-by-N, where M is
the number of
% data points and N is the number of coordinates for each data point. The
% coordinates for each cluster center are returned in the rows of the matrix
% CENTER. The membership function matrix U contains the grade of membership of
% each DATA point in each cluster. The values 0 and 1 indicate no membership
% and full membership respectively. Grades between 0 and 1 indicate that the
% data point has partial membership in a cluster. At each iteration, an
% objective function is minimized to find the best location for the clusters
% and its values are returned in OBJ_FCN.%
% [CENTER, ...] = FCM(DATA,N_CLUSTER,OPTIONS) specifies a vector of options
% for the clustering process:% OPTIONS(1): exponent for the matrix U (default: 2.0)% OPTIONS(2): maximum number of iterations (default: 100)% OPTIONS(3): minimum amount of improvement (default: 1e-5)
% OPTIONS(4): info display during iteration (default: 1)
% The clustering process stops when the maximum number of iterations
% is reached, or when the objective function improvement between two
% consecutive iterations is less than the minimum amount of improvement
% specified. Use NaN to select the default value.%
% Example
% data = rand(100,2);
% [center,U,obj_fcn] = fcm(data,2);
% plot(data(:,1), data(:,2),'o');
% hold on;
% maxU = max(U);
% % Find the data points with highest grade of membership in cluster 1
% index1 = find(U(1,:) == maxU);
% % Find the data points with highest grade of membership in cluster 2
% index2 = find(U(2,:) == maxU);
% line(data(index1,1),data(index1,2),'marker','*','color','g');
% line(data(index2,1),data(index2,2),'marker','*','color','r');
% % Plot the cluster centers
% plot([center([1 2],1)],[center([1 2],2)],'*','color','k')% hold off;%
% See also FCMDEMO, INITFCM, IRISFCM, DISTFCM, STEPFCM.
% Roger Jang, 12-13-94, N. Hickey 04-16-01
% Copyright 1994-2002 The MathWorks, Inc.
% $Revision: 1.13 $ $Date: 2002/04/14 22:20:38 $
% %后是说明部分,从此处开始是函数定义
if nargin ~= 2 & nargin ~= 3,
error('Too many or too few input arguments!');
end
data_n = size(data, 1);
in_n = size(data, 2);
% Change the following to set default options
default_options = [2; % exponent for the partition matrix U
100; % max. number of iteration
1e-5; % min. amount of improvement
1]; % info display during iteration
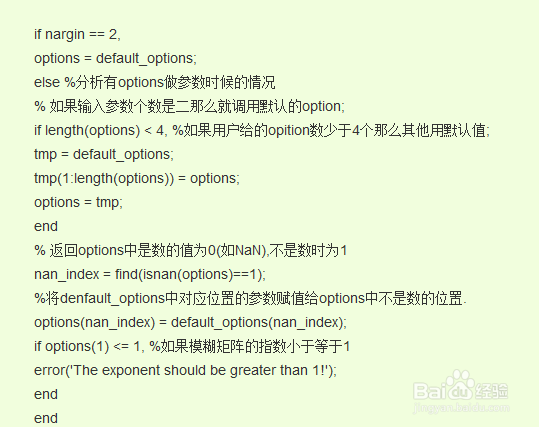
if nargin == 2,
options = default_options;
else
% If "options" is not fully specified, pad it with default values.
if length(options) < 4,
tmp = default_options;
tmp(1:length(options)) = options;
options = tmp;
end
% If some entries of "options" are nan's, replace them with defaults.
nan_index = find(isnan(options)==1);
options(nan_index) = default_options(nan_index);
if options(1) <= 1,
error('The exponent should be greater than 1!');
end
end
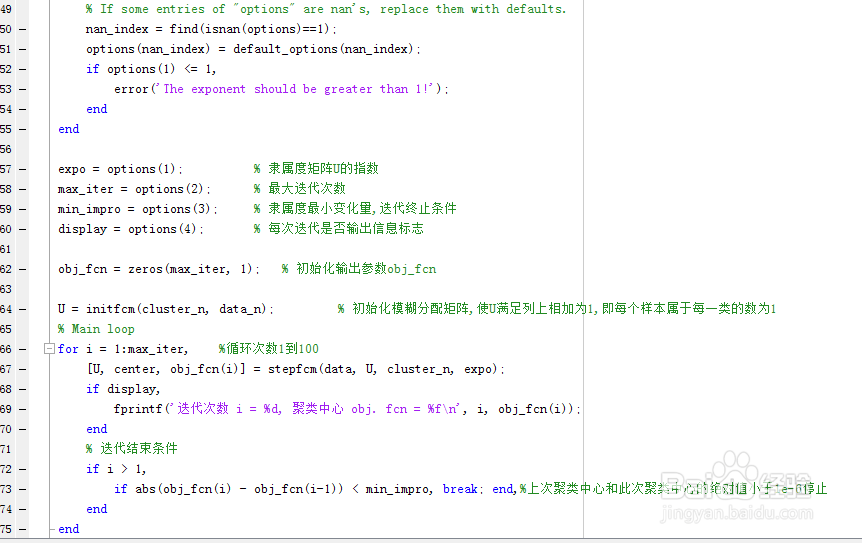
expo = options(1); % Exponent for U
max_iter = options(2); % Max. iteration
min_impro = options(3); % Min. improvement
display = options(4); % Display info or not
obj_fcn = zeros(max_iter, 1); % Array for objective function
U = initfcm(cluster_n, data_n); % Initial fuzzy partition
% Main loop
for i = 1:max_iter,
[U, center, obj_fcn(i)] = stepfcm(data, U, cluster_n, expo);
if display,
fprintf('Iteration count = %d, obj. fcn = %f\n', i, obj_fcn(i));
end
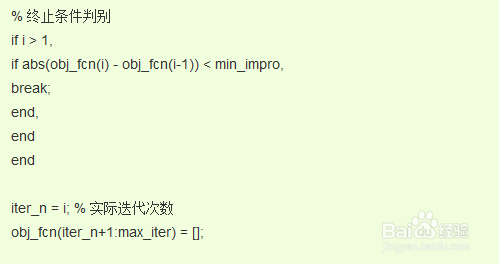
% check termination condition
if i > 1,
if abs(obj_fcn(i) - obj_fcn(i-1)) < min_impro, break; end,
end
end
iter_n = i; % Actual number of iterations
obj_fcn(iter_n+1:max_iter) = [];
英文看起来比较郁闷的看中文如下


2、关于初始化子函数 function U = initfcm(cluster_n, data_n), 代码全解如下

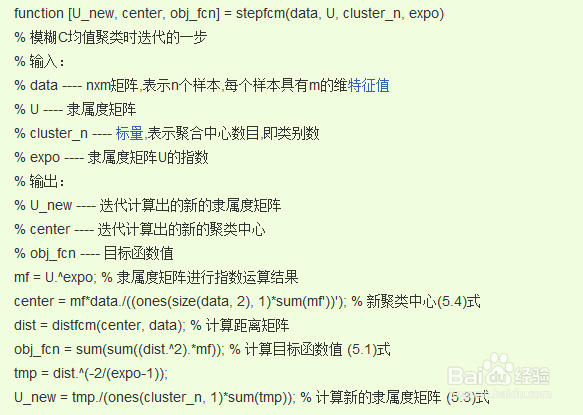
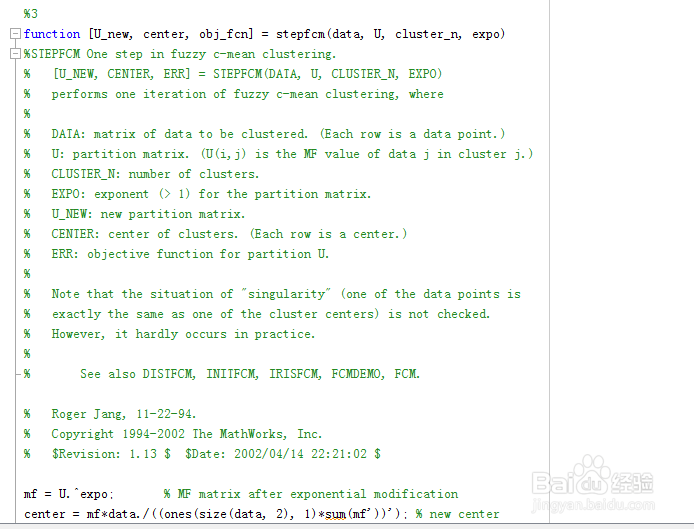
3、下一个迭代子函数 function [U_new, center, obj_fcn] = stepfcm(data, U, cluster_n, expo)
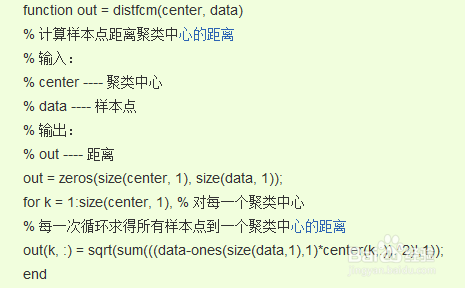
4、下一个计算距离子函数 function out = distfcm(center, data)
5、所以这些函数都是用matlab 自带的函数,包括子函数,你可以把所有的函数放在一个M文件中 下面将贴出我自己的关于FCM的全码,都是在自带函数基础上改的,


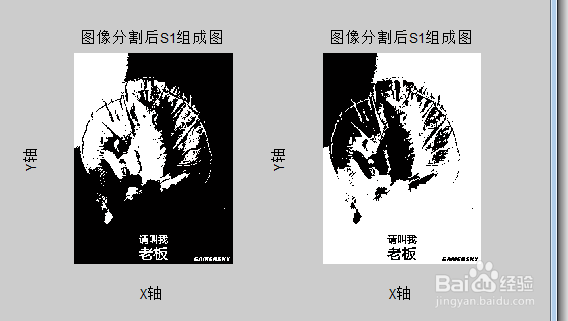
6、接着进行图像分割,调用代码如下,可以直接输入在命令窗口中,这段代码大家要好好研究

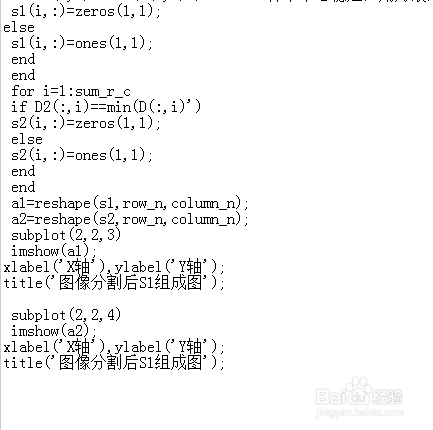
7、下面展示下效果图,有迭代次数,聚类中心,还有分割后的图像。大家研究下吧