用matplotlib画极坐标图像
1、绘制极坐标图像:
import matplotlib.pyplot as plt
import numpy as np
a = plt.subplot(121, projection='polar')
b = plt.subplot(122, projection='polar')
t=np.linspace(0,2*np.pi,30) #采样
a.plot(t,np.sin(3*t),'.',c='g',)
b.plot(t,np.sin(3*t),'-',c='r',)
plt.show()

2、增加采样数:
t=np.linspace(0,2*np.pi,60)

3、一般的,采样数越大,曲线看起来越光滑:
import matplotlib.pyplot as plt
import numpy as np
for n in range(30,101,5):
a = plt.subplot(121, projection='polar')
b = plt.subplot(122, projection='polar')
t=np.linspace(0,2*np.pi,n)
a.plot(t,np.sin(3*t),'.',c='g',)
b.plot(t,np.sin(3*t),'-',c='r',)
plt.savefig(str(n)+'.png',dpi=100)
plt.show()

4、第二幅图的线条变细:
b.plot(t,np.sin(3*t),'-',c='r',lw=0.5)

5、用虚线绘制图像:
b.plot(t,np.sin(3*t),'--',c='r',lw=1)

6、用虚线和点交替绘制图像:
b.plot(t,np.sin(3*t),'-.',c='r',lw=1)

7、用像素点画图:
b.plot(t,np.sin(3*t),',',c='b',)

8、用三角形代替点:
b.plot(t,np.sin(3*t),'^',c='b',)

9、用三尖形代替点:
b.plot(t,np.sin(3*t),'1',c='b',)

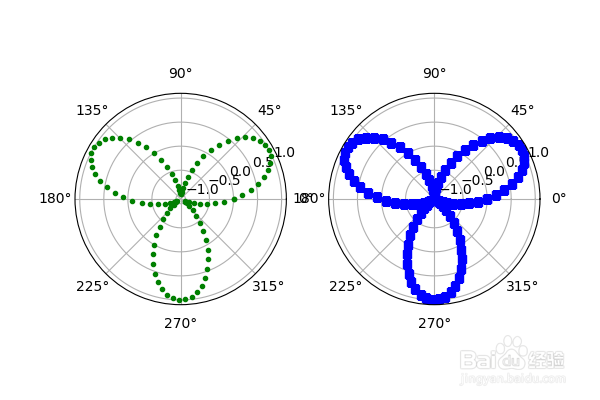
10、用正方形代替点:
b.plot(t,np.sin(3*t),'s',c='b',)
11、用平行四边形代替点:
b.plot(t,np.sin(3*t),'d',c='b',)

12、用短线代替点:
b.plot(t,np.sin(3*t),'_',c='b',)
